Personal Finance Excel Spreadsheets


Notice: The following spreadsheets are NO LONGER under Beta-level development or are being updated with current financial data. For those interested in updating and extending them, they are available for download under the GNU General Public License, version 3.0 (GPLv3) open source license.

You may download individual spreadsheet files by clicking on the links in the lists of spreadsheets below. Clicking on a particular spreadsheet link will download the Excel spreadsheet file to wherever your computer saves downloaded files (e.g., "download" directory on Windows, etc.)

  • The Income Planning Tool or IPT is an Excel spreadsheet that calculates a personal finance glide-path of cash-flows from yearly income streams while subtracting expenses and taxes. This spreadsheet, comprised of a collection of worksheets, estimates yearly income from various sources: work, Social Security, pensions, annuities, and insurance; contributions and withdrawals from deductable retirement accounts (IRA, 401(k), 403(b), etc.), Roth IRAs, and savings investment accounts, and 529 education savings accounts. Contributions and withdrawals may be specified for the investment and expense accounts. These may be entered as scheduled (i.e., periodic with optional COLAs)) or irregular (upcoming additional expenses - e.g., trip around the world, new house, new car, etc.), or both. The spreadsheet then estimates yearly federal tax rates, cash flows, and investment account balances as they accumulate. Results are presented as tables and glide-path graphs. To use the spreadsheet, enter your current data into red cells in the data entry worksheets. Also enter your age(s), estimates of the stock, bond and cash returns, CPI, COLAs, insurance, etc. The spreadsheet then estimates future values in the accounts affected. The Demo version of the spreadsheet contains demonstration data examples that exercise all options. The User version provides no demonstration data; it is the version you might use to enter your data. If you are interested, review the IPT-Introduction (PDF) - the first worksheet of the IPT that describes how to use the spreadsheet (or downloading the spreadsheet itself and read the Introduction worksheet there).

    DOWNLOAD: Download individual Excel files by clicking on the links for particular files in the following spreadsheet descriptions. Click on the link to download the Excel spreadsheet file to the location that your computer saves downloaded files (e.g., "download" directory on Windows, etc.). To edit and save your data, the version of Excel on your computer may require you to click on "Enable Editing" if it says "Protected View" at the top of the screen when you first start the spreadsheet.

    Full Demonstration Data
    • IPT-Demo-V.0.27.03-01-18-2017a.xlsx
    • The full version demonstrates examples of typical user data for all data entry worksheets. In addition to demonstrating the spreadsheet, it is useful for seeing examples of typical answers.
    User Entered Data
    SUMMARY: This Excel spreadsheet is designed for people who want to plan for future income, saving, and spending needs. It calculates rough estimates of saving and spending patterns over time. You must enter summaries of a range of your personal financial data as required by the model. These include applicable investments (taxable and retirement), pension, Social Security, work, annuity, optional 529s, and expenses. The final results are shown in summary tables and glide-path graphs for those tables. All data are entered and calculations are done only in this spreadsheet. No data are exported or saved from the spreadsheet (either locally or to the Internet). Once the data are entered, the spreadsheet estimates yearly cash-flows using income from various sources: work, pensions, Social Security, annuities, and life insurance benefits; contributions and withdrawals from tax-deferred 401(k), 403(b), 457(b), IRAs, Roths, and savings investment accounts. The spreadsheet estimates yearly investment returns, taxes on investment returns, and expenses. It estimates yearly Federal tax rates and resulting cash-flows are estimated. The spreadsheet allows for scheduled and irregular (upcoming additional) contributions and withdrawals for investment accounts (IRA, Roth, Savings) as well as for scheduled and irregular expenses and deductions. From this data, the spreadsheet then calculates yearly net worth. Glide-path tables and graphs are created are useful for investigating different planning scenarios by making changes to inputs.

    The IPT software may be run in a variety of spreadsheet programs including Windows Excel, the free OpenOffice or LibreOffice "calc", Google "sheet". The spreadsheet doesn't use Microsoft Visual Basic as VBA is not available in all spreadsheet programs. Apple's "numbers" spreadsheet program has some incompatibilities, so use either Excel for Mac or one of the free spreadsheet programs.

    Why model? Although models by nature are imprecise, calculating a rough estimate of your income stream may be useful for financial planning. The spreadsheet represents a compromise between complexity and completeness and leans in the direction of a simpler model. As statistician George Box noted, "All models are wrong, but some are useful." To illustrate the concept of glide-path modeling, a very crude glide-path calculator, "SimpleCalc", is available (both as a worksheet in the IPT spreadsheet and as a separate spreadsheet). This may be useful for you to experiment with to better understand the concept of  glide-path before using the full IPT spreadsheet, which uses a more complete financial planning model.  These spreadsheets are educational tools.

    See Appendix D in the the IPT spreadsheet for the latest status and more detailed Revision-Notes History.

        Revision notes for the V.0.27.03-01-18-2017a. Updated 2017 tax-tables data in 2. TaxData worksheet. Added optional 529 education accounts worksheet. The 529 data was then integrated into the S.Setup S.2, 11. CashData Worksheets. Tables and graphs were added to R. Results R.5.3 to refect the new optional 529Data worksheet. Added additional references to the RS. Resources. The 11. CashData subtables 11.1, 11.2 and 11.3 were reorganized to handle the additional optional 529Data entries. Added additional subsections in Appendix B B.5.2 expenses calculator to let you add entries and also compute both working and retired expenses.
        Revision notes for V.0.25.02-10-02-2016a. Added optional alternate COLAs for S1 and S2 in the 10. ExpensesData 10.2.1 irregular expenses data entry table. This lets you specify COLAs for expenses that you expect to have a much higher or lower COLAs than the default expense COLA specified in 10.1.2. If the alternate COLA value specified is 0%, it defaults to the default expenses COLA. An example might be future college costs that may be on the order of 5%. Some COLAS may even be negative. Values of the S1 and S2 alternate COLAs not zero are flagged with a green background. Also, fixed non-critical retirement age display link in 10.1 ExpensesData "S2" yearly expenses after retire at age".
        Revision notes: for V.0.24.17-09-22-2016c. Changes were made based on some initial feedback from Bogleheads.org. The FAQ was edited and added entry 16. "Why are there separate COLAs for various income sources Work, Pension, Social Security and Annuities worksheets?". Added optional COLA override for the Work and Annuity data. Otherwise it uses the CPI. The TODO-List was updated for clarity. The ease of navigation to the Results worksheet 
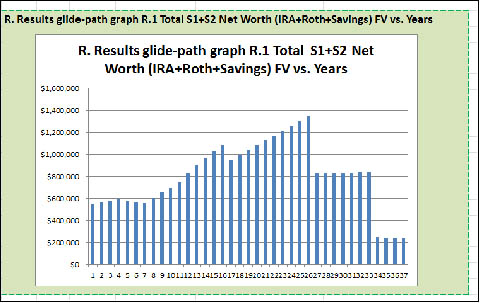
was improved from all data entry worksheets. A dynamic total summary net worth glide-path results graph was added to each editable data entry worksheet so users may immediately see the results of any changes they make to the data as shown in this screenshot:
         

  • The SimpleCalc-V.0.4.2-09-16-2016a.xlsx spreadsheet calculates an elementary retirement glide-path showing your finances over time. Enter a few required parameters and the spreadsheet computes a table of savings over time. The table data are also plotted as a glide-path graph, shown in the following screen shot. At retirement, it estimates your expenses as a percentage of your earlier income. This is taken from social security annuity income and the remainder take from (or added to) your savings. If your savings run out over time, then that age is an estimate of the longevity of your savings. The savings contributions, expenses, Social Security are adjusted yearly by the rates and CPI specified. This spreadsheet is the same as the SimpleCalc worksheet included in the IPT spreadsheet above and is offered as separate spreadsheet for convenience. Enter your data in the red cells overwriting the existing demonstration data.


  • Additional Personal Finance Excel Spreadsheets

    Here are a few additional spreadsheets that may be useful. They are not part of the IPT spreadsheet.

  • The Generic-Internal-RateOfReturn-2007-2016-rev.02-16-2017.xlsx spreadsheet estimates the 10 year (2006-2016) Internal Rate of Return (IRR) of an investment portfolio and compare it to that of a Total Markets Portfolios IRR corresponding to your personal asset allocation.
    VERSION: 0.5 Beta, 2-16-2016

  • The SpendableNetWorth-2015-V.4-08-05-2016.xlsx spreadsheet estimates how much your invested assets are worth as spendable assets (i.e. after taxes). You may estimate this three ways: 1) if the assets are sold slowly over a lifetime; 2) you may optionally sell some of your assets from your taxable investment, tax-deferred IRA or Defined Contribution (DC) plan (above the RMD amount) accounts; and alternatively, 3) you may liquidate all of your assets in one year putting you into a higher tax bracket.
    VERSION: 0.5.4 Beta, 8-05-2016

  • The Chained-CPI-U-calculation-V.4-08-05-2016.xlsx spreadsheet estimates the effect of changing the Social Security COLA from CPI-W to the Chained-CPI-U. It could also be used for estimating the effect of using in the CPI-E (elderly) that has been proposed from time to time.
    VERSION: 0.4, 8-05-2016.

  • The Simple Asset Allocation calculator using Index Funds-2-17-2017.xlsx spreadsheet helps compute the dollar amounts for a simple asset allocation using broad total market index funds or index-ETFs. Broad index funds include total U.S. stock market, total international stock market (no U.S. stocks), and Total bond market (U.S. only). One could also add municipal and international bonds/bond funds, CDs, money markets and bank accounts. Some instances of these funds are listed with 1,3,5,10,15 yr past returns. Expected portfolio returns for a 3-fund portfolio are computed) before and after expected inflation. An example is shown for using free back-testing software to see how well your asset allocation might have done.
    VERSION: 2-17-2017.

  • 
    
    Disclaimer: The software computes various personal finance estimates using simplified models. No claim is made to the accuracy, suitability, and correctness of the algorithms. Note, estimates become less accurate over time. As the software uses static models and static rates of return, CPI, etc., it will not track actual market values over time. The software uses only Excel formulas and does not use Visual Basic (VBA), so one may easily review all computations as desired. Because it uses generic spreadsheet coding (with no VBA), it will run in a variety of spreadsheet programs such as Windows Excel, free OpenOffice or LibreOffice "calc", free Google"sheet", etc. Use this software at your own discretion and risk, as an initial way to think about personal finance problems. This is educational software. Absolutely no warranty is offered for this software and no responsibility is taken for any errors in or use of the software.

    Revised: January 27, 2020
    Contact: finplan-IPT@gmail.com
    Web-site: GitHub IPT server