The National Cancer Institute Real Time Picture Processor
This history was compiled by Peter Lemkin with interviews,
recollections, and content from Lewis Lipkin, George Carman, Bruce
Shapiro, and Morton Shultz and some of the users (Carl Merril, Peter
Sonderegger, Eric Lester). It could not have been done without
everyone's input, which is reflected throughout the history. See the
Acknowledgements for additional
credits and information on online reference material donated as part
of this history. [The image above is a portion of one of the
buffer memory boards
used in the RTPP.]
1. Introduction
The Real Time Picture Processor (RTPP) was one of the first
special-purpose hardware computers developed for grayscale image
processing and was designed to aid in biological image analysis. It
was developed at the National Cancer
Institute (NCI) of the National
Institutes of Health (NIH).
Many properties of biological materials can be visualized directly
using microscopy, electrophoresis, or other visualization mechanisms.
The image subjects may have been improved before digital image capture
using various detection-enhancement methods (such as stains, dyes,
autoradiography, phase-contrast, interference microscopy, etc.) to
visualize the data of interest. Digital image processing (see wikipedia.org
 and dictionary.com
entries) is a method for the separation, detection, and quantification
of the objects of interest in biological materials. Quantified data
helps scientists perform more rigorous analyses of their biological
experiments and improve the conclusions of their analyses.
There are two major goals of this history: to document the events and
conditions that led to the creation of one of the first grayscale
image processors, and to describe the highly effective complementary
collaboration that allowed this project to flourish. Occasionally,
references will be made to other later advances indirectly related to
the RTPP work that would not have happened without the RTPP. Where
possible, we have linked to open access journal PDFs, and have included PDFs of
the key technical reports
describing the RTPP on this Web site.
and dictionary.com
entries) is a method for the separation, detection, and quantification
of the objects of interest in biological materials. Quantified data
helps scientists perform more rigorous analyses of their biological
experiments and improve the conclusions of their analyses.
There are two major goals of this history: to document the events and
conditions that led to the creation of one of the first grayscale
image processors, and to describe the highly effective complementary
collaboration that allowed this project to flourish. Occasionally,
references will be made to other later advances indirectly related to
the RTPP work that would not have happened without the RTPP. Where
possible, we have linked to open access journal PDFs, and have included PDFs of
the key technical reports
describing the RTPP on this Web site.
 back to top of section
The birth of the concept of the RTPP
The RTPP project was conceived and initiated by Dr. Lewis "Lew"
Lipkin, M.D., head of the Image Processing Unit, later the Image
Processing Section (IPS), in the the National Cancer Institute
(NCI). The intellectual concept behind computer-controlled microscopy
started in 1962 when Lew was an assistant professor of neuropathology
at Downstate Medical Center in New York. Professor Patrick
Fitzgerald, Chairman of the Pathology Department at Downstate, was
studying pancreatic cell growth. Dr. Vinichaichol, who was doing
visual grain counts on thin pancreatic sections, was finding mixed
results. The problem was statistical. Dr. Lipkin was asked to design a
proper sampling technique. Grain counting was a method
used to measure cell metabolism before the days of antibody techniques
applied to living cells and fluorescent techniques that came about
during our time in NIH. Lew, who happened to know something about
statistics, was asked by Dr. Fitzgerald to find out what was wrong
with his statistics. After some thought, Lew realized that
Dr. Vinichaichol was staying in one area of the slide and he had no
way of knowing when he was recounting the same cells. Lew didn't want
to continue looking at biological material that he couldn't explore
without using some form of quantification.
Lew's solution was to view the slide as an array, a 2-dimensional (2D)
matrix where each visible area had a unique 2-dimensional address on
the slide. The sections were very thin so that all the grains at a
location were visible; the Z-axis in this case could be ignored. Lew's
system used a list of random number XY positions, which were applied
to each slide. Dr. Vinichaichol would go to these areas and count
whatever grains were there. If there were no cells, there were zero
counts. And suddenly everything fell together. The new method was what
Dr. Fitzgerald needed. This result was published in 1968 in the
American Journal of Pathology Fitzgerald,
P. et.al., 53(6):953-970, "Pancreatic acinar cell
regeneration. V. Analysis of variance of the autoradiographic labeling
index (thymidine-H3)."
So Lew conceived of the idea to use the microscope slide as an
information resource in 1962. This work also created the concept of
the researcher creating a "pick-list" of cell positions that could be
used in future analysis. Over time there were many extensions to this
concept. For example, one could sample a set of picked-out cells in a
tissue culture and make periodic measurements over time, or scan the
image with different wavelengths of light to take advantage of
different staining characteristics.
Dr. Richard Masland, M.D., the director of the National Institute of
Neurological Disease and Blindness (NINDB), invited Lew to join the
National Institutes of Health (NIH) in 1962. Lew was one of perhaps 20
neuropathologists in the country at the time. Later NINDB became the
National Institute of Neurological Disorders and Stroke (NINDS). NINDB was looking for a
neuropathologist for the Perinatal Research Branch (PRB) headed by
Dr. Heinz Berendes, M.D. When he first came to NIH, Lew was determined to
build something that implemented his ideas of mapping in biological
images. He had an original LINC
(Laboratory INstrument Computer created at MIT with NIH funding)
computer at the time. Later, Lew upgraded this to a Digital
Equipment Corporation
(DEC) LINC-8
.
The problem: he had a microscope and he had a computer. How could he combine the
two?
The first thing he wanted to be able to do was move a slide via a
computer-controlled microscope stage. Initially, he was going to do it
with analog feedback. He talked to Wes Clark (who had helped build
the LINC computer with Charlie Molner and others). Wes convinced Lew
that he really wanted a digital stage - not an analog one - so that is
what Lew developed: a series of stepping-motor-controlled stages that
improved with each generation. The original design connected the stage
with rubber bands, which was then greatly improved with direct
stepping-motor drives. Lew had also been working with Russell Kirsch
and Bill Watt from the National Bureau of Standards (NBS, now the
National Institute of Standards and Technology or NIST
).
This early work involved describing
biological images using computer picture grammars [1]
that attempted to bring artificial intelligence and algorithmic methods to the
description of biological images.
back to top of section
Evolution of the computer-controlled microscope
In 1968, I (Peter Lemkin) joined Lew's group to work on programming
the LINC-8 along with Howard Shapiro of the PRB, and Russell Kirsch,
Don Orser, and Phil Stein from the NBS who had been involved in the
project. The first lab was in rental space in the Auburn Building
across from the Bethesda Chevy Chase Rescue Squad where we would hear
the fire trucks when they went out on a call. The group moved to the
brand new Building 36 on the NIH Bethesda campus around 1970, which
was a much better environment. (Building 36 was demolished in 2006.)
The LINC-8 controlled a stepping-stage and a galvanometer scanner with
a photomultiplier detector on a Leitz microscope, which was an early step in
automated cytology [7]. It was very slow, but
did offer high-quality 8-bit data. The problem was analysis power - in terms of
scanning speed, CPU speed, image memory, analysis software, and
analysis memory. It became clear that we did not have the hardware
resources required to do complex image processing on the types of data
we were determined to analyze. However, I learned to write hardware
control software on the LINC-8 as it was truly a dedicated laboratory
instrument computer ideal for connecting to laboratory equipment. This
experience set the stage for the next generation of
computer-controlled microscopes we tackled.
The second computer-controlled microscope project was the NCI grain counter
[2] that is
discussed in its own section. Advancements in electronics technology
enabled us to design the grain counter using high-speed shift-register
memory chips to capture X,Y coordinates from a 10 frame/second
non-interlaced TV system (
Imanco Quantimet 720
).
Despite these advances, for larger image memories
such as was needed for the RTPP, it would have been very difficult to
implement image processing algorithms. This is because shift-register
memory has delays in accessing any particular image pixel datum since
the data must cycle around the circular shift register before the
computer could access it. For complex algorithms with millions or
billions of operations, this would be intolerable.
The culmination of these efforts was the Real Time Picture Processor (RTPP)
described in journal papers
[3,
4,
5,
6],
as well as technical reports to be
discussed and listed at the end of this history. We started this
project just as the new Texas Instruments 4K
bits X 1-bit dynamic RAMs (Random Access Memory - see history of
DRAM
)
became available. Their availability was discovered by
George Carman who proceeded to design the RTPP using these new chips.
Many skilled people made this project possible: the superb computer
hardware architecture work by George and the mechanical engineering
work by Sprague Hazard; the coming together of the right group of
people, with synergistic skills who got along as a family, at the
right time when the technology and the NIH's support resources were
available; the NCI's Director Seymour Perry and administrator Bill
Penland gave us crucial encouragement and financial support. Dr.
Perry invited us to move to NCI as the Image Processing Unit (IPU)
about 1972. In projects of this type, there is a window of time when
the technology is appropriate for the job. Without the 4K dynamic
RAMs, the RTPP would not have been possible. We were doing
cutting-edge research, but a year or two later, charge-coupled devices
would make their appearance and eventually make much of our design
obsolete. But that is the nature of progress.
We left NINDB for the IPU in the early 1970s and became the Image
Processing Section (IPS) at NCI about 1980, and moved to the Park
Building, Parklawn Drive, in Rockville. Although the members of the IPS
went on to work in other areas not directly related to the RTPP, this
history will concentrate on the work that was directly related to the
RTPP.
back to top of section
The unique RTPP parallel-bus architecture (at that time)
One of the unique aspects of the RTPP was to implement the design as
special-purpose parallel hardware with a flexible bus-architecture and a
microcoded instruction
set that reflected the types of operations routinely performed in
image processing
[3-4,
TR-2,
TR-7,
TR-7a,
TR-22].
Although other image processing computers were available, such as the ILLIAC-III
,
using a microcode architecture enabled an image processor to be constructed
and built less expensively but with greater flexibility than building
it entirely with discrete hardware. The special-purpose hardware could
make real-time results possible (defined as reasonably fast enough to
incorporate human feedback in tuning algorithms, such as interactively
adjusting detection thresholds, etc.). A National Technical
Information Service (NTIS)technical report
[TR-7] describing the RTPP was one of the frequently requested
reports one month as reported in their monthly newsletter for
November 1976 under
computer topics.
Today, special digital signal processing (DSP) chips, very fast
processors and memories perform this type of processing (used in video
games, pocket cameras, and cell phones for example), rendering the
original 1970s RTPP design obsolete. However, many of the concepts
used in the RTPP design were unique and influenced other image
processing hardware designs. As another example of this trend,
confocal microscopy using a huge amount of image processing and memory
is today routinely being done on small but powerful PC laboratory
computers. Special-purpose hardware is no longer required.
The RTPP design was to be constructed in two stages: an image buffer
memory subsystem, and later the General Picture Processor (GPP)
[3-4,
TR-2,
TR-7,
TR-7a,
TR-16,
TR-22]. The image memory was part of a
grayscale digital image-capture system that was successfully used in
various biology research areas to help analyze optical microscope
images - both static and dynamic time-lapse, 2-dimensional (2D)
electrophoretic gel images, and RNA electron micrographs of secondary
structure, and other biological materials. It was used from about
1976 until it was decommissioned in 1984. For the second planned
stage we had completed the design. However, the GPP was never
constructed since high-speed computer technology was advancing rapidly
and increasingly available to researchers, and it was difficult to
justify additional research funds. The technology paradigm had
shifted.
Scientists used the RTPP as finally constructed to analyze data in a
variety of biomedical domains including optical microscope images of
optical serial sections of brain tissue, stained bone marrow smears,
and tissue cultures using phase contrast and differential interference
optics. The latter was used in tracking cell membrane extents of
macrophages in tissue culture over time as the cells tried to
phagocytize various types of asbestos fibers. The goal was to better
understand fiber carcinogenicity and the dynamics of fiber ingestion
[8,
9,
10].
The bone marrow smear image analysis was part of my
Ph.D. dissertation
[11,
12,
TR-653,
TR-655].
The RTPP was also used for 2D
electrophoretic gel images for a variety of biological materials
[13,
14,
15,
16,
17,
18,
19,
20,
21,
22,
23,
24,
25,
26,
27,
28,
29,
30,
31,
32],
and for RNA electron micrographs of secondary structure,
which was part of Bruce Shapiro's Ph.D. dissertation
[33,
34,
35,
36,
37,
38,
TR-BAS78].
 Figure 1. Dr. Lewis Lipkin headed the project. His group started
working on computer-controlled optical microscopy in the Perinatal
Research Branch (PRB) of NINDB. The group later changed its name and
institutes to the Image Processing Unit (IPU) in NCI in the Laboratory
of Pathology. IPU later became the Image Processing Section (IPS) in
NCI. The Section later became part of the Laboratory of Mathematical
Biology (LMMB) in NCI under Dr. Charles DeLisi, Ph.D., and still later
under Dr. Jacob Maizel, Ph.D.. The laboratory changed its name to the
Laboratory of Experimental and Computational Biology (LECB) under Jake
Maizel. The laboratory refocused on nanobiology and was then called the
Center for Computer Research Nanobiology Program (CCRNP) directed by Dr.
Robert Blumenthal, Ph.D. The Laboratory was dissolved in 2014.
Figure 1. Dr. Lewis Lipkin headed the project. His group started
working on computer-controlled optical microscopy in the Perinatal
Research Branch (PRB) of NINDB. The group later changed its name and
institutes to the Image Processing Unit (IPU) in NCI in the Laboratory
of Pathology. IPU later became the Image Processing Section (IPS) in
NCI. The Section later became part of the Laboratory of Mathematical
Biology (LMMB) in NCI under Dr. Charles DeLisi, Ph.D., and still later
under Dr. Jacob Maizel, Ph.D.. The laboratory changed its name to the
Laboratory of Experimental and Computational Biology (LECB) under Jake
Maizel. The laboratory refocused on nanobiology and was then called the
Center for Computer Research Nanobiology Program (CCRNP) directed by Dr.
Robert Blumenthal, Ph.D. The Laboratory was dissolved in 2014.
back to top of section
2. The Real Time Picture Processor Development Team
The following individuals were involved with the design and
development of the RTPP. The history goes into the who, what, where,
when, and why. The second list enumerates some of the individuals
doing biomedical research in which the RTPP played a role.
Major RTPP designers and developers
- Lewis Lipkin, M.D., (mathematics and physical chemistry,
and a neuropathologist), Head of the Image Processing Section (IPS);
previously the (PRB, NINDB) and then the Image Processing Unit
(IPU) in the NCI.
- Peter Lemkin, Ph.D. & M.S. EE, computer scientist and
electrical engineer, IPS/NCI, and previously in
(PRB, NINDB) and in IPU/NCI
- George Carman, M.S. EE, electrical engineer and computer hardware
architecture, Technical Development Section (TDS), NINDB;
Carman Engineering (now Lucidyne Corp
).
- Morton Schultz, B.S. EE, electrical engineer,
IPS/NCI, and previously in IPU/NCI
- Bruce Shapiro, Ph.D., B.S. math & physics, computer
scientist, IPS/NCI, and previously in
(PRB, NINDB),and in IPU/NCI
- Sprague Hazard, mechanical engineer (contractor consultant)
- Peter Kaiser, B.S. CS, computer scientist (IPU) in the NCI
- Earl Smith, M.S. CS, computer scientist (IPU) in the NCI
- Dan Kilgore, B.S. EE, computer programmer
[Digital
Equipment Corp
(DEC) software engineer]
- Tom Duval and later Jim Camper, electronics technicians - helped
construct the RTPP racks, and power-supplies cabinets
- Cambion Corporation, wire-wrapped the remaining 63 buffer memory
boards and the back-planes
Where: PRB was the Perinatal Research Branch in the National
Institute of the Neurological Disease and Blindness (NINDB). IPU was
the Image Processing Unit of the National Cancer Institute (NCI). The
IPU later became the Image Processing Section (IPS).
Who: The initial participants were Dr. Lewis Lipkin, myself,
and George Carman. Later in the process, Morton Schultz and Bruce
Shapiro joined the design group. Peter Kaiser and Earl Smith
participated for a few years. During this time, Bruce Shapiro and I
were part-time Ph.D. students in the Computer Science Department of
the University of Maryland with Professor Azriel Rosenfeld, one of the
early leaders in the field of image processing. Both Bruce
[35,
37,
38,
39,
TR-BAS78] and I
[8,
12,
TR-653,
TR-655]
wrote dissertations on
image processing. We were able to combine some of our applied NIH
research as part of our Ph.D. research and use what we were learning
about image processing and computer science to our NIH
research. George was able to apply many of the ideas he had learned
with his masters in Computer Hardware Architecture.
back to top of section
Major RTPP users and their biomedical research
Below are some of the biomedical research projects in which the RTPP
played a role.
- Lewis Lipkin: optical microscopy of serial brain sections and
macrophage motility measurements with asbestos
- Peter Lemkin: bone marrow smear analysis, 2D gel electrophoresis
- Bruce Shapiro: RNA secondary structure of electron micrographs
- Carl Merril: NIMH/NIH - 2-dimensional (2D) gel electrophoresis,
E.coli mutants and macrophages with asbestos
- Jacob Maizel: NICHD/NIH, with Bruce Shapiro - RNA electron
microscopy of secondary structure
- Eric Lester: NCI, U. Chicago, and oncology practice -
2D gel electrophoresis on human leukemias
- Steve Aley and Russell Howard: NIAID/NIH - 2D gel electrophoresis
of Plasmodium knowlesi clones
- Peter Wirth and Snorri Thorgeirsson: NCI/NIH - 2D gel
electrophoresis on liver cell lines
- Peter Sonderegger: NICHD/NIH and U. Zurich - 2D gel
electrophoresis of axonal proteins of sensory and motor neurons
 Figure 2. One of the first images taken using the RTPP was of the
development group just after we got the Digital Equipment Corporation
DECsystem-2020 interface to the RTPP buffer memory working. The image
was one we called "mcrew" (i.e., 'machine crew'). Top row (L-R): Dan
Kilgore, George Carman, and Morton Schultz. Bottom row (L-R): Earl
Smith and Peter Lemkin. Not shown: Bruce Shapiro and Lew Lipkin who were
integral parts of the RTPP design and development team.
Figure 2. One of the first images taken using the RTPP was of the
development group just after we got the Digital Equipment Corporation
DECsystem-2020 interface to the RTPP buffer memory working. The image
was one we called "mcrew" (i.e., 'machine crew'). Top row (L-R): Dan
Kilgore, George Carman, and Morton Schultz. Bottom row (L-R): Earl
Smith and Peter Lemkin. Not shown: Bruce Shapiro and Lew Lipkin who were
integral parts of the RTPP design and development team.
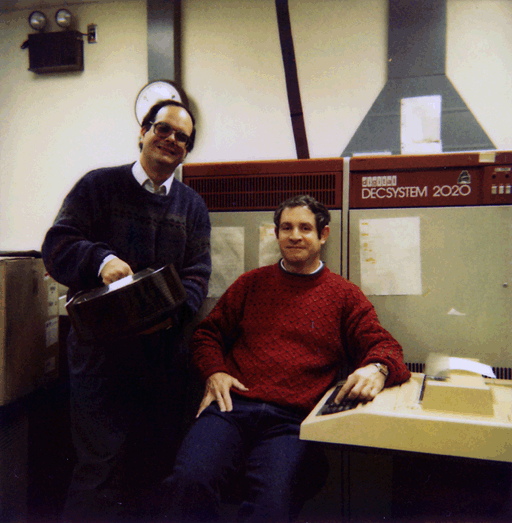 Figure 3. The Digital Equipment Corporation DECsystem-2020
running the
TOPS-10
operating system. The system is shown with Bruce Shapiro,
holding a removable 180MB "bathtub" size disk pack (on the left), and
Peter Lemkin (on the right). It had 512K words, 36-bits/word, 256K
word virtual space/user, a very powerful instruction set, and many
high-level computer languages, including SAIL (Stanford Artificial
Intelligence Language - see wikipedia.org entry on SAIL)
,
that made implementing complex analysis algorithms much
easier than on the PDP8e. SAIL was developed by Dan Swinehart and Bob
Sproull of the
Stanford AI Lab
in 1970. Sproull was at Division of Computer
Research and Technology (DCRT) in the early 1970s and introduced the
language to DCRT [the precursor of NIH's Center for Information Technology
(CIT)]. Over time, we implemented more of the advanced image
processing and pattern recognition algorithms in SAIL, using the RTPP
as a sophisticated data acquisition and interactive graphics
front-end. Later many of these algorithms were rewritten in C and UNIX
using X-windows (we rewrote the C/UNIX/X-windows GELLAB-II
exploratory analysis system from the SAIL/TOPS-10/RTPP GELLAB-I), and
in LISP (StructureLab with a
Symbolics Lisp machine and later a Unix Platform) when the
DECsystem-10/20 computer lines were phased out in favor of the VAX
computer lines. Later still, much of the C code for GELLAB-II was converted
and rewritten in Java and used as part of the Open2Dprot
project. We will discuss some of these projects later under the section Applications of the RTPP in Biomedical
Research.
back to top of section
Figure 3. The Digital Equipment Corporation DECsystem-2020
running the
TOPS-10
operating system. The system is shown with Bruce Shapiro,
holding a removable 180MB "bathtub" size disk pack (on the left), and
Peter Lemkin (on the right). It had 512K words, 36-bits/word, 256K
word virtual space/user, a very powerful instruction set, and many
high-level computer languages, including SAIL (Stanford Artificial
Intelligence Language - see wikipedia.org entry on SAIL)
,
that made implementing complex analysis algorithms much
easier than on the PDP8e. SAIL was developed by Dan Swinehart and Bob
Sproull of the
Stanford AI Lab
in 1970. Sproull was at Division of Computer
Research and Technology (DCRT) in the early 1970s and introduced the
language to DCRT [the precursor of NIH's Center for Information Technology
(CIT)]. Over time, we implemented more of the advanced image
processing and pattern recognition algorithms in SAIL, using the RTPP
as a sophisticated data acquisition and interactive graphics
front-end. Later many of these algorithms were rewritten in C and UNIX
using X-windows (we rewrote the C/UNIX/X-windows GELLAB-II
exploratory analysis system from the SAIL/TOPS-10/RTPP GELLAB-I), and
in LISP (StructureLab with a
Symbolics Lisp machine and later a Unix Platform) when the
DECsystem-10/20 computer lines were phased out in favor of the VAX
computer lines. Later still, much of the C code for GELLAB-II was converted
and rewritten in Java and used as part of the Open2Dprot
project. We will discuss some of these projects later under the section Applications of the RTPP in Biomedical
Research.
back to top of section
3. The NCI Autoradiograph Grain Counter: Precursor of the RTPP
The Real Time Picture Processor project was initiated after the
successful completion of another project, the National Cancer
Institute (NCI) autoradiograph grain counter [2].
This was one of the first
computer-controlled microscopes (from the "NIH Record," about
1974). At the time, fluorescent antibodies were not commonly used for
quantifying metabolism, so cell metabolism was often measured using
autoradiography methods. When cells were grown in tissue culture with
3H-radiolabeled media, the radioactivity incorporated into
cells could be used to estimate their metabolism. Dried slides of the
cell culture sample were coated with photographic emulsion and exposed
for weeks to months in the dark. They were then photographically
developed making the silver grains embedded in the emulsion
visible. Grains could be tracked and uniquely counted by serially
focusing through the emulsion as individual grains were followed. The
number of grains was proportional to the amount of
3H-radiolabeled media taken up by the cells and was a
quantitative measurement of metabolism. The user would select a set of
cells to be counted, adding them to the pick-list, and then let the
machine automatically revisit the cells and make the grain counting
measurements.
back to top of section
The Grain Counter Project was the first major project for the RTPP Design Team
The grain counter system was constructed by George Carman, an
electrical engineer who was finishing up at the National Institute of
Neurological Disease and Blindness (NINDB) at the time and later
worked on the project under contract; me, an electrical engineer who
was starting a part-time Ph.D. program in computer science; and Lewis
"Lew" Lipkin, a neuropathologist with extensive computer software and
hardware experience. Lew's group was transitioning from NINDB to
NCI. George was in the Technical Development Section (TDS) at NINDB
under Jim Bryan and Ted Coburn, who were experts in analog
circuits. The TDS provided all types of electronics and mechanical
engineering support for NINDB from basic design services to machine
shops that helped us enormously. Sprague Hazard was one of their
expert mechanical engineering consultants and later became one of
ours. George had just finished his masters in computer hardware
architecture before coming to NINDB and was well versed in digital
circuits. Lew contacted the TDS to help with the digital logic for the
early stepping-motor-controlled digital stage and George
responded. Lew and George hit it off very well, as each understood and
appreciated the other's area of expertise. George had just finished a
project for TDS working with Jim Bryan that involved capturing XY
coordinates from an analog TV camera so they could be recorded on a
DEC PDP12 computer. When Lew described the grain counting problem and
discussed the capturing of XY coordinates with George for the future
grain counter, George already knew how to do it. That's how it
started.
The grain counter consisted of a small Quantimet image processing
system, a Zeiss Isoplan microscope with a Zeiss XY-axes stepping-motor
controlled stage and a Z-axis (i.e., focus) stepping-motor-control
that we added. The mechanical setup was designed with the help of the
TDS machine shop. A PDP8e computer was interfaced to this data
acquisition hardware and stepping-motor (X,Y,Z)-axes control. The
operator would find a radio-labeled cell using a joystick (X,Y)
control and a Z-axis controlled stage. They would then initiate a data
capture of the (X,Y) coordinates of all of the silver grains in the
field into a hardware shift register. This would then be transferred
to the PDP8e for each 0.2 micron steps in the Z-axis as the microscope
focused up and down for thick sections. The grains were tracked
between optical serial sections and the actual count of grains for the
entire cell recorded without double-counting grains.
back to top of section
DEC's Fortran-II allowed direct access to new I/O hardware
We were able to easily control the microscope and process the data
using a small amount of PDP8e memory because of the computer language
used. DEC's Fortran-II software language compiler running under their
OS/8 operating system for the PDP8e allowed the insertion of assembly
language that could reference I/O instructions (called IOPs) directly
and could also directly reference Fortran variables. This made
programming our new hardware relatively easy to do.
The following is an example of Fortran-II mixed code from the RTPP
BMOMNI I/O software library (used to access the RTPP hardware from the
PDP8e). For those interested, several technical reports available in
this history describe the RTPP I/O instructions and design in more
detail
[TR-7,
TR-7a,
TR-21,
TR-22,
TR-23].
The "S" in column 1 indicates that that line should be treated as assembly
language; an assembly code variable with a "\" in front of it
indicates it is a Fortran variable. The same code style was used with
the grain counter as with the RTPP. On the surface, Fortran-II was
not a very powerful language, but the combination of these two
features made it ideal for easily programming special purpose
hardware. We had learned how to control hardware from the software
for the grain counter, so that hurdle was already solved when we
tackled the RTPP hardware/software-interfacing problem. The success
of this hardware/software/microscope system gave us the confidence to
go to the next level, a general-purpose image-processing computer that
was the RTPP. There is more discussion and the
BMON2 source code later in this history.
The plan was to have the NCI replicate these grain counter systems in
three or four grantee laboratories. We had put out bids for the
replication of the system. But, as with many technological
break-throughs, the system worked, but better, less-expensive methods
using new antibody and flow cytometry methods were becoming
available. So autoradiography was replaced by other systems for
measuring and quantifying specific cell types where tracking
individual silver grains was not required. The additional grain
counters were never built.
back to top of section
4. Description of the NCI RTPP
The Real Time Picture Processor consisted of the following integrated
components:
- a Digital Equipment Corporation (DEC) PDP8e computer, which acted
as a controller
- a commercial Quantimet 720 analog video image processor with both
vidicon and plumbicon non-interlaced high-resolution 10 frame/second
TV cameras
- an image buffer memory that contained eight 256x256 16-bit pixel
video memories (which could be used for display as sixteen 256x256 or
four 512x512 8-bit grayscale memories, and/or computation)
- a controller for the image buffer memory interfaced to the PDP8e
and Quantimet TV display
- and a future design of a parallel special-purpose general picture
processor (GPP) to operate on the buffer memory.
The block diagrams for this configuration are shown in Figures 4 and
5. The Quantimet was designed to perform simple binary
thresholding of video analog data and counting operations on the
non-interlaced analog video signal, but could not perform complex
grayscale operations such as neighborhood computations. Later the
RTPP/PDP8e system was interfaced to a DECsystem-2020 computer running
the TOPS-10 operating system. Image acquisition and user interaction
were relegated to the RTPP/PDP8e while complex analyses were done on
the DECsystem-2020. Many of the figures illustrating the RTPP were
drawn by Jo Abbott, our secretary and graphics draftsperson, during
the initial design phase before we moved to the Park Building.
back to top of section
Axiomat microscope z-axis control
The Quantimet plumbicon analog video camera was attached to a
computer-controlled Zeiss Axiomat microscope with (X,Y)-axes (0.5
micron/steps) Zeiss stepping-motor stage, and Z-axis focus (0.2
micron/step) stepping-motor controlled by the PDP8e. The anti-backlash
Z-axis stepping-motor control-assembly was added with the help of
Sprague Hazard (the same TDS consultant we had used with the grain
counter project), and constructed by the NINDB machine shop. The
advantage of Hazard's brilliant anti-backlash Z-axis design was that
by moving past the point of interest and then reapproaching it from
the same direction each time, one minimized mechanical hysteresis so
that random accessed points of the slide could be repositioned quite
reliably in three dimensions. Lew's idea of the slide as a 2D array
information resource had been expanded to a 3D array (X,Y,Z). The
Quantimet analog vidicon camera was used with regular 35mm camera
lenses with a uniform illumination light-box for scanning 2D
electrophoretograms, electron micrographs of RNA molecules, and other
image sources (see figure 18). It
was used with a variety of normal, wide-angle and macro-zoom lenses
depending on the material we were investigating. The cameras could be
easily switched. The plumbicon had a more linear and wider dynamic
range and was better suited for microscopy.
back to top of section
The first stage of the RTPP design - the image buffer memories
The RTPP digital image capture system was called the image "buffer
memory" and could capture images directly from the selected Quantimet
video camera. Using a $10,000 high-speed analog-to-digital converter
(A/D) that was the size of a large DVD player, the analog video was
digitized to be captured into the image buffer memories. Similarly,
the digital output from the buffer memory was displayed on the
Quantimet TV monitor through a high-speed digital-to-analog (D/A)
converter. The RTPP system could display the live video or video
derived from the image buffer memory on a high-resolution (860x720
pixels - high resolution at that time) non-interlaced TV display. This
part of the system was completed and used in many projects. Today,
digital cameras and cell phones with cameras have similar A/D and D/A
capabilities for under $100.
Because the buffer memories were easily random accessed (one of the
advantages of using RAMs instead of shift-register chips), it was in
effect a 1-megabyte extension of the PDP8e memory that had a maximum
of 32K 12-bit words. We used this to advantage when constructing
various complex segmentation and spot pairing algorithms implementing
linked-lists stored in the buffer memories. Occasionally, we would
drop a bit in the buffer memory and the program would crash or go into
an infinite loop as the linked-list got corrupted. However, on the
whole, the buffer memory design was state-of-the-art at the time and
allowed many of the applications we had created to work as well and to
push the envelope on what could be done.
back to top of section
The second phase of the RTPP design - General Picture Processor
The second phase of the RTPP was the design of a special-purpose
48-bit triple-operand, real-time computer processor called the General
Picture Processor or GPP. This GPP would perform parallel image
processing operations on 3x3 pixel neighborhoods in the buffer memory
throughout the selected images. The GPP design had two input operands
and one output operand. Each operand was assigned to an image buffer
(there were sixteen 256x256 8-bit pixels per image buffer). The GPP
included 3x3 pixel triple operand instructions, which would tessellate
over the entire 256x256 pixel image space. The design is described in
[3-4,
TR-7,
TR-7a,
TR-22].
A software assembler for the GPP instruction set (GPPASM) [TR-16] and a
debugger (DDTG) [TR-2] for the GPP were
written on the PDP8e and ready to use with the hardware when it was
built. The GPP hardware part of the RTPP was not completed due to a
shift in NCI budget priorities. Considering the exponential increase
over time in computing power of general-purpose microprocessors as
well as their greatly decreasing cost, this was probably a wise
decision. It became clear that software efforts would be more
effective for many (but certainly not all!) problems. The paradigm had
shifted.
The design of the RTPP was presented at the 1973 Asilomar Third
Engineering Foundation Conference on Automated Cytology
and published in 1974
[3-4].
This conference and a subsequent automated
cytology workshop concentrated on the two solutions then available:
image processing and pattern recognition of cell images, and the
evolving field of flow cytometry. NIH was funding both fields. During
this time we developed plans for integrating artificial intelligence
techniques for understanding and analyzing biological materials and
systems incorporating the RTPP, and these were also presented at the
Asilomar workshop [5,
TR-15].
back to top of section
5. The Design Process for the RTPP
The project was started about 1972. By this time, George Carman had
left the National Institute of Neurological Disease and Blindness
(NINDB), moved to Oregon and was working under contract with our
National Cancer Institute (NCI) group. I had been working on a
Ph.D. in computer science at the University of Maryland with
specialization in image processing and so had Bruce Shapiro. So the
General Picture Processor (GPP) design reflected many of the
requirements of image processing methods. Lewis "Lew" Lipkin, with his
broad understanding of image processing, was also heavily involved in
the design. Lew, Bruce, and I would discuss the types of image
processing operations we required in brain storming sessions. Then,
George and I would have long phone-conversation design sessions where
I described the image processing needs discussed in the local Image
Processing Unit's group design sessions to George who then worked out
the details on how to implement the required operations in the
hardware design. I documented these design sessions, which resulted in
the technical reports
[TR-2,
TR-7,
TR-7a,
TR-16,
TR-21,
TR-21b,
TR-22].
The hardware system design was a joint effort with primary hardware
electronics design by George Carman and primary software design by me.
The RTPP electronics design was incrementally created in many
hours-long phone conferences between George and myself discussing and
negotiating requirements for image processing, possible
implementations, implications of the designs for hardware and for
software, etc. These long, detailed discussions reviewed and modified
our snail-mailed blueprints and design documents (this was before
e-mail and common access to the Internet). Our phone sessions allowed
the iteration, refinement, and extension of the design to take into
account the difficulty of programming the proposed hardware and the
difficulty and expense of building the hardware. This joint design
also allowed the IPU (me in particular) to start building the PDP8e
software to interface with the hardware before the RTPP was delivered.
In the end, both goals were optimized and the system worked. Some of
this process was described in
[3-4]
and a few of the critical design ideas are listed in this history in some
of the figures.
back to top of section
Building the image buffer memory boards
Once George wired and debugged one of the buffer image memory boards,
we had a contractor, Cambion Corporation, build the remaining 63
boards (see an example of a board in figures 8 through 10 below). Each board
consisted of 64 4K-bit dynamic RAMs (Random Access Memory chips). Four
boards implemented a 256x256 pixel by two 8-bit bytes sub-image. These
were among the first "high" density memory chips available at the
time. Of course being the first generation of a high-density dynamic
RAM chip, they had a high failure rate. So George built memory-testing
software on the PDP8e that could pinpoint a bad chip on a particular
board enabling us to unplug the bad chip and replace it with a new
one. This saved a huge amount of time in finding the bad chips and
helped improve uptime of the RTPP during its lifetime.
Not only did Cambion build the buffer memory boards, but using their
standard technology, they also wired much of the backplanes. Their
technology was an integrated system, and had been developed for rapid
prototype construction in aerospace projects. It included cards,
sockets, and racks. The system would not have worked had the parts
been obtained from different vendors. By adapting Cambion's
standards, we were able to take advantage of the reliability Cambion
had developed for this kind of work. After Cambion created the boards
and backplanes, our electronics technicians assembled them into
several cabinets of 19" vertical racks including one cabinet for the
power supplies. The buffer memories were 16 cards to a rack, with
four racks. To avoid overheating, the cards were inserted in every
other slot. Then the equipment was shipped to George in Oregon to
finish construction and debugging. We had purchased a PDP8e for him
to use in developing, debugging, and testing the interface. The
computer was also critical for George to create various software tools
to help manage the project. These included a wirewrap database program
that could take pairs of (drawing #, chip #, pin #) triples that
indicated a pair of wires to be connected using a technique called
"wirewrap." This methodology was critical since a single buffer memory
card was described in a large number of blueprints and it would be
difficult to keep straight which pins connected to other pins in this
complex global diagram. George then wrote additional software to
translate these pairs to the standard lists that Cambion required. In
a biomedical image processing and electronics conference, George's
triple notation and his new way to handle the increasing complexity of
multiple drawing wiring lists received a good reception from some of
the developers of VHDL
(a hardware description language). Because of space limitations,
George put the PDP8e into a closet of his house with additional AC
cooling. The PDP8e at that time cost more than his house. Today, the
most inexpensive computers are many orders of magnitude more powerful
than the PDP8e at a small fraction of their cost.
back to top of section
Delivery and debugging of the RTPP hardware
After George got major parts of the system working in Oregon, he
shipped the multiple electronics racks to Building 36 in Bethesda
about 1976. He flew in for a week to help debug the initial buffer
memories, the RTPP controller, and the connection to the Quantimet
both for display and data capture. George and Mort Schultz, did a
marathon week of late-night engineering debugging to work out some of
the final kinks. Many pizzas helped fuel these sessions. I had been
working in parallel on the software interface called BMON (Buffer
Memory Monitor System), which was then tested against the hardware to
see if it worked more or less according to the design. Hardware and
software were iteratively changed as required to accommodate each
other.
Later, Mort and I worked with George over the phone for additional
sessions to further debug the hardware and integrate the first stage
RTPP with the initial PDP8e control software. After George went back
to Oregon, Mort had spent many hours with his hands-free phone headset
talking to George and probing the RTPP with Tektronix oscilloscopes
and test instruments including digital analyzers. The latter proved to
be invaluable in debugging not only the RTPP, but also other digital
interfaces to the DECsystem-2020 (to be discussed) and other
systems.
A more robust version of the control software was called BMON2 (Buffer Memory Monitor System) was
written and used to interact with the RTPP. It integrated other
programs and scripts that analyzed data from the RTPP
[40,
TR-21,
TR-21b,
TR-23].
BMON2 was written in Fortran-II under the
PDP8e OS/8 operating system. As with the grain counter project, the ability to mix assembly language in with the
Fortran allowed easy control of the more than 100 hardware
instructions that we added to the RTPP controller (See
[TR-7a]
for details).
back to top of section
The microscope design - the Axiomat
Under Lew's direction - and based on his long experience as a
microscopist - the microscope concepts evolved over several
generations of computer-controlled designs. The engineering machine
shop in NINDB in Building 36 constructed the microscope assembly for
the NCI grain counter project. They had an outstanding mechanical
engineer consultant, Sprague Hazard, who previously solved some of the
very tricky issues including removing the hysteresis in the Z-axis
stepping-motor control for the grain counter microscope. He designed
additional hardware for the microscope using anti-backlash gears with
an approach similar of running the
stepping motors that we had used in the grain counter. We used
this method in the commercial X,Y microscope stepping-motor stage. He
also designed a color-filter changer that implemented Lew's insistence
on the importance of monochromatic light in micrographic analysis. The
changer would swap interference filters in the light path. These
successful experiences in constructing the grain counter were then
leveraged when we built a new microscope around the Zeiss Axiomat for
the RTPP - again with the help of Sprague Hazard who incorporated some
very creative ideas.
The Axiomat was a dream microscope. (A photograph
is available on Zeiss's microscope history Web page.) The microscope
complex grew in the sense that as we wanted more and more control of
the microscope functionality, we added it. In addition to control of
the stage and control of the Z-axis, we also wanted control of the
frequency of light that went through it. Although we experimented with
various color selection methods, we settled for using interference
filters. The RTPP and the microscope were controlled in real-time by
a polling routine in BMON2 with the (X,Y,Z) direction control
switches, A/Ds, and other states available for programs needing this
data. Of course Lew Lipkin's pick-list idea was implemented and was
part of BMON2.
In retrospect, we made one mistake in designing the optical
microscope. It should have been an inverted microscope from the start
because most of our efforts dealt with living cultures. It was
difficult to do a living culture. To put a tissue culture plate down
on the stage, you had to use inverted objectives because of the
standard microscope structure. The optical path was such that the
index of refraction of the culture flask introduced so much of an
optical path that only the lower power inverted objectives could be
used.
back to top of section
RTPP and the move from Bethesda to the Park Building in Rockville
We had started constructing the RTPP when we were in Building 36
(NINDB's building) in Bethesda and around 1980, we were moved to the
off-campus Park Building because we had switched from NINDB to NCI,
and NCI had no extra lab space available on the Bethesda campus. In
moving, we had to dissemble the RTPP and PDP8e racks, Quantimet,
Axiomat microscope, etc., and reassemble the system at the Park
building. With George's help (he flew in again), Mort got the system
back on the air within a reasonable time.
In addition to all the system components that were moved, we also
moved a two-ton marble vibration isolation table that floated on air
cylinders. The table, about 6' x 4' x 8", was used to isolate the
microscope/scanner system from building vibrations. We had also used
a smaller version of the floating marble table with the grain counter
project and had been pleased with its result. One of the concerns in
the move was getting this very heavy marble block up the elevator
(hoping that the elevator didn't break loose or the floor cave in). In
any case, it worked well in the new building.
Another concern was the electrical system. Before we moved to the
Park building, Mort checked out the building's electrical system and
found that it did not have adequate grounding. If this was not
corrected, then we would be picking up noise through the power lines
to the equipment. So he had the building engineers install
ground-coupled copper-braided cables to improve the electrical
system. Another problem was the building management's installation of
a huge building power transformer right in the middle of our
electronics area, which caused major 60Hz interference in the
equipment. This problem was corrected by having the transformer moved
to a non-critical area.
The Park Building was less than ideal, because of frequent loss of
power, loss of air-conditioning (the temperature rising to over 100
degrees F one time destroyed several boards in the DECsystem-2020),
and roof-leaks on the computers whenever it rained hard. In short, it
was a terrible building. We had mix-ups including advertising mail
addressed to "Mr. Park Building." But, during the time in the Park
Building, we began to use the RTPP more heavily and then built a
second stripped-down version of the RTPP with the same type of PDP8e
and image buffer memories, but with a Conrac TV monitor, graph-pen
tablet (for entering x,y, data), and without the fancy control
desk.
back to top of section
BMON2 software control program for the RTPP
The software control program for the buffer memory I constructed on
the PDP8e was called BMON2 (the Buffer Memory Monitor System)
[40,
TR-21,
TR-21b,
TR-23]
and written in Fortran-II. BMON2, in addition
to interfacing with the RTPP, also allowed running other programs to
be batched to analyze the data. Given that the PDP8e had 32K words of
memory, this was critical for doing complex sequential operations and
for easily writing new RTPP applications. A Fortran-II library that
could interface with the RTPP, BMOMNI [TR-23],
allowed these other
programs to access the RTPP as required. (See discussion on Fortran-II in the section on the grain
counter. This shows the BMOMNI Fortran code.) BMON2 could capture and
display images and do many image processing operations on the
PDP8e. Another program called FLICKER [13]
ran on the PDP8e and was
used to analyze 2D gel images visually by alternately displaying one
movable image on the video screen relative to another that was held
in a constant screen position. Later, it allowed the comparison of two saved images as
well. So a set of images could be compared against a reference sample.
Some of the ideas on using flickering images to detect subtle
differences in image matching were suggested by Bernice Lipkin, who is
an expert in psychopictorics [41].
A third-generation version of
FLICKER is available as open-source software at
http://open2dprot.sourceforge.net/Flicker
.
back to top of section
Fortran-II source code of BMON2 and the image processing functions
For those interested in how we coded various image processing functions,
we have an annotated
list of the BMON2 Fortran-II programs and libraries. If you look at this,
you might want also to take a look at the associated paper and technical
reports on BMON2 which describe the design in more detail
[40,
TR-21,
TR-21b,
TR-23].
back to top of section
The DECsystem-2020 and the RTPP
A Digital Equipment Corporation DECsystem-2020
was installed in the laboratory after we moved to the Park Building. We
had been using the NIH's Division of Computer Research and Technology
(DCRT) [now the Center for Information
Technology (CIT)] DECsystem-10 time-shared system. As we used TOPS-10 operating
system on the DECsystem-10, we installed TOPS-10 on the new
DECsystem-2020. Bruce Shapiro had implemented a message-switching
high-speed 9600-baud (normal speed was 300 or 1200 baud at the time)
serial line multiplexor so we could move images and data to/from the
DCRT system. However, the costs for the increasing amount of time we
used on the DCRT system was escalating. For a cost comparable to
renting time over a few years, we could purchase a dedicated system
and have more compute power as well. So NCI supported us in purchasing
the DECsystem-2020. This was a DEC Unibus system, which meant we could
interface our hardware to this then-powerful 36-bit computer. In
hindsight, this was one of the best procurements that Lew made. It
offered us vastly better opportunities to interact with and manage the
data that would not have been possible with a 9600 baud serial line.
We could write software in the SAIL language, which meant we would have much
more expressive power than we had with the PDP8e or PDP11 computers
and could apply more advanced algorithms. This made a real difference
in the productivity in analyzing real data with powerful algorithms.
The RTPP/BMON2 system was later interfaced to a DECsystem-2020 running
the TOPS-10 operating system. The RTPP was triple-ported in a
priority network to the Quantimet TV camera, the Quantimet display,
and finally the PDP8e (via Direct Memory Access (DMA)), in that order,
so as to minimize interference with the TV camera and display. DMA
would occur during the TV horizontal-sync line-refresh times when the
user would not notice it on the TV.
Later, the DECsystem-2020 was connected to the RTPP/PDP8e via a DMA
interface. A DMA device on the PDP8e was connected by cable to a DMA
interface (DR11-W) on the DECsystem-2020. An advantage of the
DECsystem-2020 over the earlier PDP10 computer was that although it
was a 36-bit/word computer, the 2020 could use less expensive 16-bit
Unibus peripherals. Dan Kilgore of the Large Systems Group of DEC was
contracted to write a TOPS-10 device driver to access this interface
on the 2020. The 2020 system had the computational power required for
larger, more complex projects because of its larger programming memory
(512K 36-bit words), powerful instruction set, and the high-level SAIL
language (Stanford Artificial Intelligence Language), an extended
ALGOL-60 dialect. Later, Mort Schultz built a 500-Kbits/second
high-speed serial line between the PDP8e and the DECsystem-2020 to
control the PDP8e and thus BMON2 from the DECsystem-2020. This allowed
the 2020 to treat the PDP8e as a slave processor and be controlled by
software rather than typing on the PDP8e's terminal.
back to top of section
The PDP11 virtual device control between the DECsystem-2020 and Comtals
In addition to the RTPP, we acquired Comtal
image processor systems that had Q-bus type PDP11 interfaces. These
in turn were interfaced to a PDP11/40 computer that was connected to
the DECsystem-2020 via software called SPIDER, a virtual device driver
network. SPIDER allowed PDP11 computers to be accessed from the
DECsystem2020 without writing a new DECsystem-2020 driver for each new
PDP11 device. Bruce Shapiro, our expert on PDP11s, wrote a time-shared
packet switcher on the PDP11/40 to connect PDP11 devices to this
network. I wrote the device driver on the DECsystem-2020 to access
these devices and make them available for DECsystem-2020 application
software. Images acquired using the RTPP could be analyzed on the
Comtals; Bruce used this to help analyze his nucleic acid electron
micrographs.
back to top of section
Analysis software using the RTPP/DECsystem-2020
Many software analysis systems were developed using the RTPP,
especially in the area of 2D gels with the GELLAB-I system
[13,
14,
15,
16,
17,
18,
19,
20,
21,
22,
23,
24,
25,
26,
27,
28,
29,
30,
31,
32],
a 2D gel exploratory data analysis system integrating the
image-processing with statistical databases for multiple samples
(myself); and RNA electron micrographs of secondary structure
[10,
11,
32,
39,
48,
49]
(Bruce Shapiro). After the RTPP was
decommissioned, GELLAB-I was redeveloped as a portable software system
using Unix/C/X-windows and was called GELLAB-II
[42,
43,
44,
45]
(see Lemkin's
History of GELLAB
for more details, references, and history of
GELLAB-II). Much of the work with GELLAB-I and GELLAB-II in
exploratory data analysis led to its application to the DNA microarray
domain (see
http://maexplorer.sourceforge.net/
)
MAExplorer []. A
third-generation instantiation of this data-mining system is part of
the Open2Dprot open-source project at
http://open2dprot.sourceforge.net/
with the goal of extending
proteomics data mining to 2D LC-MS, protein-arrays. Bruce went on to
develop other RNA analysis software
[35,
39,
47,
48,
49,
50],
leading to the
StructureLab project [50]
and related RNA structure analysis (see his
RNA structure
research group
).
back to top of section
6. Details on the RTPP Design
Some of the design details were unique to the Real Time Picture
Processor at that era of computer designs. A few of these are
illustrated in the following figures. The design is explained in more
detail in references [3,
4] and in technical reports
[TR-7,
TR-7a,
TR-23].
Figures 4 and 5 show block diagrams of the
components of the system. Figures 6 and 7 show the interactive control
desk that the operator used to interact with the PDP8e and thus the
RTPP.
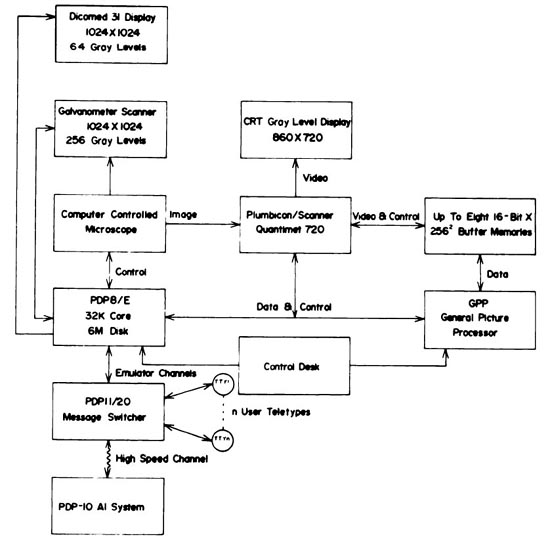 Figure 4. The Real Time Picture Processor (RTPP) block diagram
(reproduced with permission, from J. Histochem. Cytochem.
[4],
1974). This shows additional parts of the system including a PDP11/20
message switcher to a PDP-10 Artificial Intelligence system PRDL
(PRocedural Description Language)
[5,
TR-15]
originally being developed
on NIH's DCRT (now CIT) PDP-10 facility. The early microscope also had
a 1024x1024 8-bit galvanometer scanner that could be used in place of
the Quantimet 720 scanner. The later microscope was built around a
Zeiss Axiomat microscope. An early high-quality grayscale display
(Dicomed 31) was also used to make high-quality display images. Its
functionality was replaced by the Quantimet grayscale buffer-memory
display. The PDP8e accessed the RTPP using the BMON2 software
[40,
TR-21b].
The PDP-10 multiprocessor KL-10 system was a
shared time-share computer at DCRT (now CIT). This was replaced in
our design by a dedicated DECsystem-2020 when it became more
cost-effective to have a dedicated computer. The DECsystem-2020 was a
new microcoded processor that DEC was able to build for a fraction of
the cost of the PDP-10. The PRDL [TR-15] and
PROC10 [TR-8]
image processing software were created to interface with the RTPP. We had
considered creating a MAINSAIL(R)
compiler for use with the GPPASM (GPP assembler program)
[TR-16] so that we could program the GPP in a
SAIL-like language only available on large PDP-10 class systems.
Later, a light box for films was used with the Quantimet vidicon
scanner (see Figure 18) with changeable 35mm lenses (not shown in this
block diagram - see Figure 5) to scan autoradiograph and wet 2D gels,
RNA electron micrographs, and other transparencies.
Figure 4. The Real Time Picture Processor (RTPP) block diagram
(reproduced with permission, from J. Histochem. Cytochem.
[4],
1974). This shows additional parts of the system including a PDP11/20
message switcher to a PDP-10 Artificial Intelligence system PRDL
(PRocedural Description Language)
[5,
TR-15]
originally being developed
on NIH's DCRT (now CIT) PDP-10 facility. The early microscope also had
a 1024x1024 8-bit galvanometer scanner that could be used in place of
the Quantimet 720 scanner. The later microscope was built around a
Zeiss Axiomat microscope. An early high-quality grayscale display
(Dicomed 31) was also used to make high-quality display images. Its
functionality was replaced by the Quantimet grayscale buffer-memory
display. The PDP8e accessed the RTPP using the BMON2 software
[40,
TR-21b].
The PDP-10 multiprocessor KL-10 system was a
shared time-share computer at DCRT (now CIT). This was replaced in
our design by a dedicated DECsystem-2020 when it became more
cost-effective to have a dedicated computer. The DECsystem-2020 was a
new microcoded processor that DEC was able to build for a fraction of
the cost of the PDP-10. The PRDL [TR-15] and
PROC10 [TR-8]
image processing software were created to interface with the RTPP. We had
considered creating a MAINSAIL(R)
compiler for use with the GPPASM (GPP assembler program)
[TR-16] so that we could program the GPP in a
SAIL-like language only available on large PDP-10 class systems.
Later, a light box for films was used with the Quantimet vidicon
scanner (see Figure 18) with changeable 35mm lenses (not shown in this
block diagram - see Figure 5) to scan autoradiograph and wet 2D gels,
RNA electron micrographs, and other transparencies.
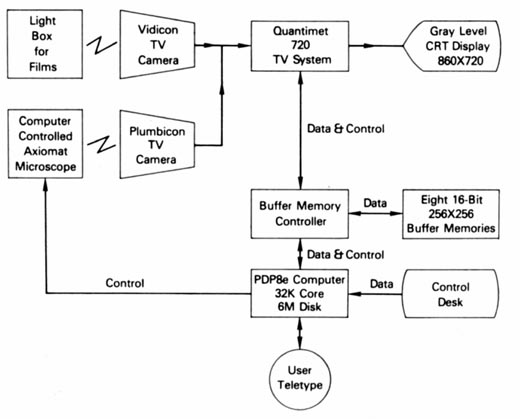 Figure 5. A simplified block diagram of the Real Time Picture
Processor illustrating the two types of input and the microscope
control from BMON2 paper
[40], 1980. (Reprinted from Computer
Programs in Biomedicine, vol 11, Lemkin P., Lipkin, L., BMON2 - A
distributed monitor system for biological image processing, pp 21-42,
Copyright (1980), with permission from Elsevier.) The PDP8e computer
directed the microscope stage to positions determined either manually
by the operator or by a list of positions defined by the user and then
controlled by the computer. Images could be acquired by the buffer
memories for processing by the BMON2 system. Raw images as well as
processed images could be displayed on the Quantimet 720 CRT
display. TV camera input was from either of the two TV cameras that
were easily changed. The user interacted with the hardware using the
control panel connected to the PDP8e using the BMON2 image processing
software system.
Figure 5. A simplified block diagram of the Real Time Picture
Processor illustrating the two types of input and the microscope
control from BMON2 paper
[40], 1980. (Reprinted from Computer
Programs in Biomedicine, vol 11, Lemkin P., Lipkin, L., BMON2 - A
distributed monitor system for biological image processing, pp 21-42,
Copyright (1980), with permission from Elsevier.) The PDP8e computer
directed the microscope stage to positions determined either manually
by the operator or by a list of positions defined by the user and then
controlled by the computer. Images could be acquired by the buffer
memories for processing by the BMON2 system. Raw images as well as
processed images could be displayed on the Quantimet 720 CRT
display. TV camera input was from either of the two TV cameras that
were easily changed. The user interacted with the hardware using the
control panel connected to the PDP8e using the BMON2 image processing
software system.
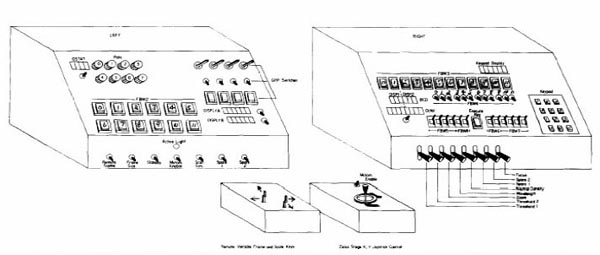 Figure 6. RTPP Control Console was interfaced to the PDP8e and used to
interact with the RTPP using the BMON2 buffer memory monitor operating
system
[40,
TR-21,
TR-21b].
See Figure 2 in [TR-21b] for the full
description. It had various knobs (connected to A/D converters read by
the PDP8e), lights for feedback, command buttons, toggle switches, and
momentary toggle switches. Only some of these controls were used in
the various programs, but having a variety of control options
providing flexibility in the user interface. However, this was
sometimes at the cost of added complexity and sometimes users had
difficulty in learning the system because of this. ("All those knobs,
buttons and switches!") However, this flexibility gave us the option
of experimenting with various interaction modes that could then be
optimized for particular analysis programs. This was before the
computer mouse and graphical user interfaces became commonly
available. (Click on this figure to bring up the high-resolution
version of the figure. You may have to make your browser window
larger.)
Figure 6. RTPP Control Console was interfaced to the PDP8e and used to
interact with the RTPP using the BMON2 buffer memory monitor operating
system
[40,
TR-21,
TR-21b].
See Figure 2 in [TR-21b] for the full
description. It had various knobs (connected to A/D converters read by
the PDP8e), lights for feedback, command buttons, toggle switches, and
momentary toggle switches. Only some of these controls were used in
the various programs, but having a variety of control options
providing flexibility in the user interface. However, this was
sometimes at the cost of added complexity and sometimes users had
difficulty in learning the system because of this. ("All those knobs,
buttons and switches!") However, this flexibility gave us the option
of experimenting with various interaction modes that could then be
optimized for particular analysis programs. This was before the
computer mouse and graphical user interfaces became commonly
available. (Click on this figure to bring up the high-resolution
version of the figure. You may have to make your browser window
larger.)
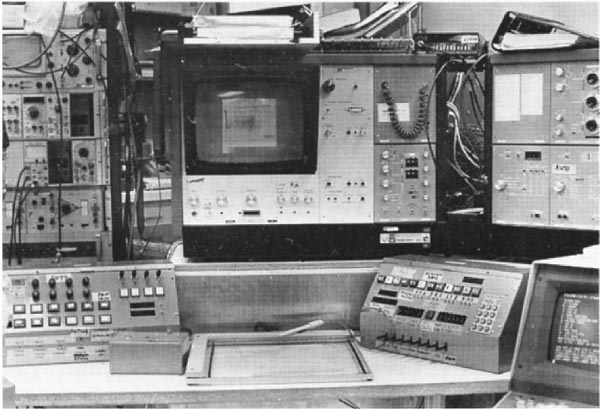 Figure 7. Photograph of the Quantimet-TV and control-console for the
RTPP using the BMON2 software
[40,
TR-21,
TR-21b,
TR-23]. This was taken after
we had moved the RTPP to the Park Building in Rockville, MD.
(Reproduced from a figure with permission from
Environmental Health Perspectives, 1980 []).
The control desk
had a microscope joystick (X,Y) and Z-axis (focus) control; knobs
(connected to A/D converters read by the PDP8e), switches and lights
that could be configured in various ways by the BMON2 software. The
small box shown in the lower left allowed us to control the 4 edges of
a frame as (X,Y) positions. It used four bi-directional two-level
spring-loaded switches in a (North, South, East, or West)
configuration. These switches came from the LINC-8 and were perfect
for this type of control. This allowed us to easily control the
direction of a cursor - much as is done today using the mouse, which
did not exist at the time). Real-time video control was performed
using the RTPP buffer memory controller hardware, which in turn was
configured by the PDP8e. The control desk gave us a lot of flexibility
- even if its complexity was sometimes compared to that of the
starship Enterprise. Various programs (BMON2, FLICKER [13],
LANDMARK in the GELLAB-I system
[15,
17,
31],
and others) could use that subset
of the controls most appropriate for the particular application.
back to top of section
Figure 7. Photograph of the Quantimet-TV and control-console for the
RTPP using the BMON2 software
[40,
TR-21,
TR-21b,
TR-23]. This was taken after
we had moved the RTPP to the Park Building in Rockville, MD.
(Reproduced from a figure with permission from
Environmental Health Perspectives, 1980 []).
The control desk
had a microscope joystick (X,Y) and Z-axis (focus) control; knobs
(connected to A/D converters read by the PDP8e), switches and lights
that could be configured in various ways by the BMON2 software. The
small box shown in the lower left allowed us to control the 4 edges of
a frame as (X,Y) positions. It used four bi-directional two-level
spring-loaded switches in a (North, South, East, or West)
configuration. These switches came from the LINC-8 and were perfect
for this type of control. This allowed us to easily control the
direction of a cursor - much as is done today using the mouse, which
did not exist at the time). Real-time video control was performed
using the RTPP buffer memory controller hardware, which in turn was
configured by the PDP8e. The control desk gave us a lot of flexibility
- even if its complexity was sometimes compared to that of the
starship Enterprise. Various programs (BMON2, FLICKER [13],
LANDMARK in the GELLAB-I system
[15,
17,
31],
and others) could use that subset
of the controls most appropriate for the particular application.
back to top of section
The buffer memory image cards
The sample card shown below (front and back) illustrates the
complexity of building large memory cards back in the early 1970s
(Figures 8 through 10). Increases in chip memory capacity enabled
enough memory to be put on a few cards to represent images with detail
sufficient for meaningful biological image analysis. Before these new
memory chips (the Texas Instruments TMS 4030 chip was a 4Kx1 bit
dynamic RAM) were available, we had planned to construct the buffer
memories using static shift-register memory chips (as George had done
in the grain counter system). Total memory pixel size was 1 megabyte
for the 64 boards - today 1 gigabyte of memory the size of a thumbnail
sells for under $25 (on sale). Not only would the static
shift-register memory chips have been more expensive, but also they
also would not have had the random access performance we required in
image processing, creating an inadequate design. The shift registers
would have led to a slower, much smaller memory using more power for
the same cost. The image pixels size and number of images in the
buffer memories would have been less and many of the powerful software
applications we used the RTPP for would not have worked as well or
even been developed.
During this time, we had the conviction, led by Lew Lipkin and George
Carman, that anything that we wanted to be do in software could be
done by a series of sequential gates. These could be proved Boolean
algebraically correct using
Karnaugh Maps
,
hardware finite state machines, and related
techniques. George had just taken a microprogramming design course as
part of his masters degree in computer hardware architecture and the
design of buffer memories and the General Picture Processor (GPP) were
perfect test beds in which to try out these new design principles
which were relatively new for projects like this. Some of the design
diagrams are shown in Figures 11 through 14 (from the Carman
[4]
paper). Figure 15 shows some examples of GPP microprogrammed
instructions for manipulating the buffer memory data. The design was
further described in some of the technical reports
[TR-7,
TR-7a,
TR-16,
TR-21,
TR-21b,
TR-22] listed at the end of this
history. Because we were prototyping the system, the card was
constructed using wire wrapping rather than multilayer printed circuit
boards. A commercial version would have used printed circuit boards,
but would only have been economically feasible if many copies of the
RTPP were produced. Using complex multi-level printed circuit boards
is generally too expensive for a research lab.
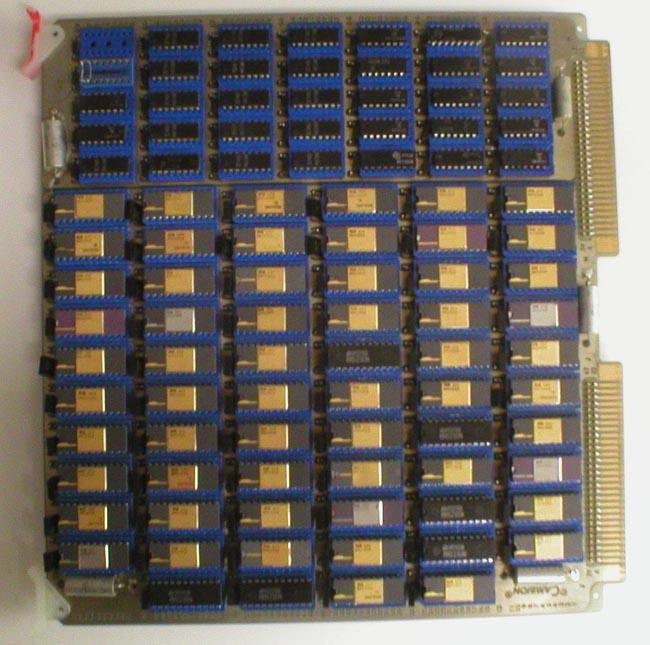 Figure 8. Front of a buffer memory image card containing 64Kb x
16-bits of dynamic RAM constructed from 4Kx1 bit dynamic RAM chips
(Texas Instruments part number TMS 4030) initially sold by Texas
Instruments and later second-sourced by National Semiconductor and
Signetics. Four boards constituted a 256x256x16-bit pixel
sub-image. Either the high or low 8-bit byte (or neither) could be
displayed. Each 256x256 sub-image could be positioned to any part of
the 860x720 pixel TV screen. For many applications, to create a
512x512 image, four 256x256 sub-images were grouped to form a 512x512
image.
Figure 8. Front of a buffer memory image card containing 64Kb x
16-bits of dynamic RAM constructed from 4Kx1 bit dynamic RAM chips
(Texas Instruments part number TMS 4030) initially sold by Texas
Instruments and later second-sourced by National Semiconductor and
Signetics. Four boards constituted a 256x256x16-bit pixel
sub-image. Either the high or low 8-bit byte (or neither) could be
displayed. Each 256x256 sub-image could be positioned to any part of
the 860x720 pixel TV screen. For many applications, to create a
512x512 image, four 256x256 sub-images were grouped to form a 512x512
image.
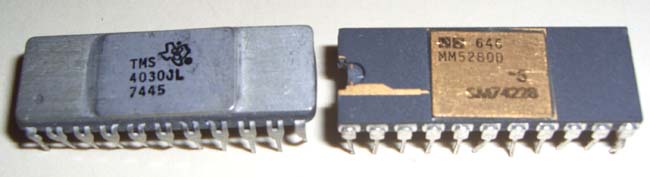 Figure 9. The 4Kx1 bit dynamic RAM or DRAM chip (part number TMS 4030)
initially sold by Texas Instruments and second sourced by National
Semiconductor, and Signetics (shown here). These were the first
affordable (about $20 at the time) DRAMs available in large
quantitities. Because chip vendors want to assure customers that the
parts will always be available, they license other chip makers to
"second source" interchangeable chips. Our memory boards are a mix of
the black, silver, and gold colored chips because we used several
vendors.
Figure 9. The 4Kx1 bit dynamic RAM or DRAM chip (part number TMS 4030)
initially sold by Texas Instruments and second sourced by National
Semiconductor, and Signetics (shown here). These were the first
affordable (about $20 at the time) DRAMs available in large
quantitities. Because chip vendors want to assure customers that the
parts will always be available, they license other chip makers to
"second source" interchangeable chips. Our memory boards are a mix of
the black, silver, and gold colored chips because we used several
vendors.
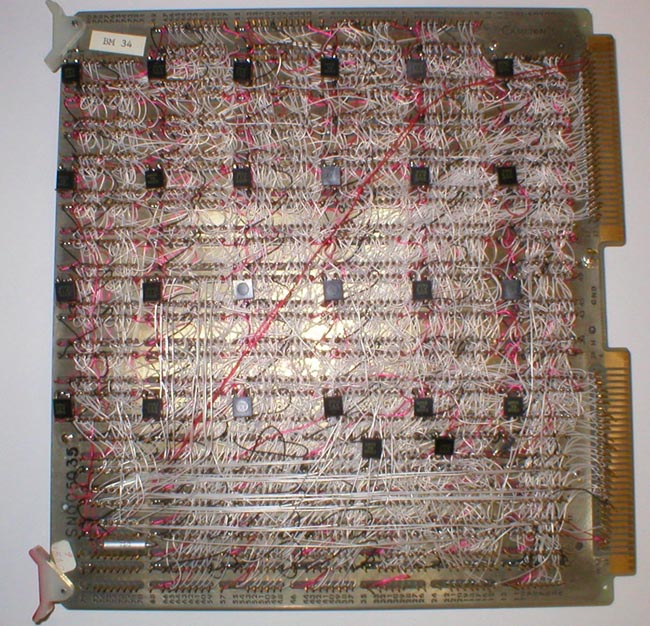 Figure 10. Back of a buffer memory image card containing 64Kb x
16-bits of dynamic RAM constructed from 4Kx1 bit dynamic RAM (part
number TMS 4030) chips initially sold by Texas Instruments and second
sourced by National Semiconductor and Signetics. There were over 3,000
wirewraps on each board. The initial card was designed and hand wired
by George Carman, and Cambion Corporation replicated 63 additional
cards with wirewrap wiring lists generated by George. Their automatic
robots would position the board for each of the wrap positions and
then wire that point. The photograph illustrates how easy it is to
get lost in this forest of pins and wires. Doing this by hand would
have been impossible. George felt that no other company could build
the boards in the time frame with the essential quality control we
required. He was right. Only one of the 63 the boards delivered was
defective, which was amazing considering the complexity and number of
boards. Because of the high frequency signals involved, George put
small black decoupling capacitors on each board to "tune" it to
minimize cross talk. So each board, then, was in some sense
unique.
Figure 10. Back of a buffer memory image card containing 64Kb x
16-bits of dynamic RAM constructed from 4Kx1 bit dynamic RAM (part
number TMS 4030) chips initially sold by Texas Instruments and second
sourced by National Semiconductor and Signetics. There were over 3,000
wirewraps on each board. The initial card was designed and hand wired
by George Carman, and Cambion Corporation replicated 63 additional
cards with wirewrap wiring lists generated by George. Their automatic
robots would position the board for each of the wrap positions and
then wire that point. The photograph illustrates how easy it is to
get lost in this forest of pins and wires. Doing this by hand would
have been impossible. George felt that no other company could build
the boards in the time frame with the essential quality control we
required. He was right. Only one of the 63 the boards delivered was
defective, which was amazing considering the complexity and number of
boards. Because of the high frequency signals involved, George put
small black decoupling capacitors on each board to "tune" it to
minimize cross talk. So each board, then, was in some sense
unique.
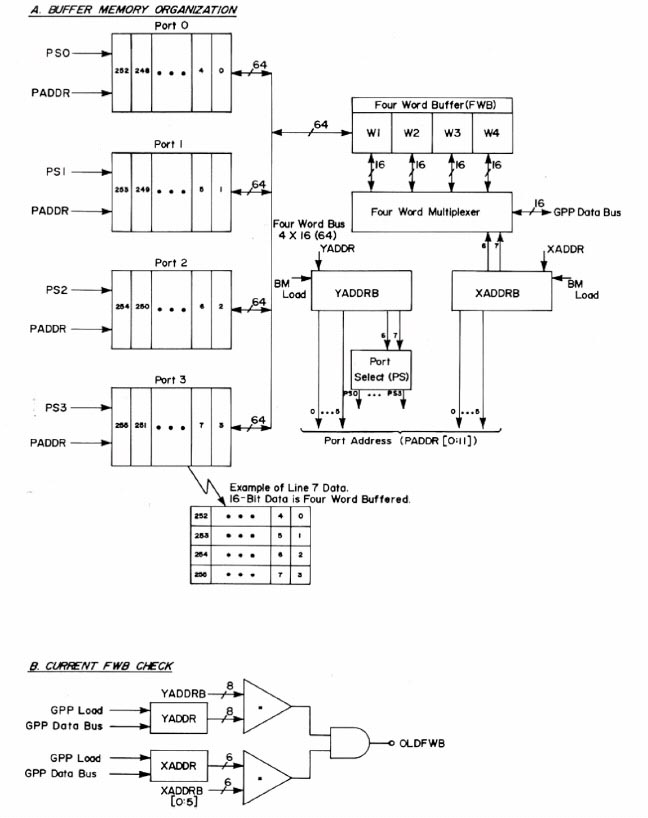 Figure 11. The RTPP buffer memory control logic (reproduced with
permission from J. Histochem. Cytochem.
[4], 1974). "Each
buffer memory is an asynchronous device that received I/O requests
either from the general picture process (GPP) or the Quantimet for
input or output. Given a request and an address, it first checked to
see whether the last (high order 14-bit address) four-word buffer
accessed was the same as that for the current request. If so, it did
not have to do another memory (RAM) cycle and the signal OLDBWB signal
is 'true'. When a read cycle occurred and a different FWB was needed,
it checked to see if the FWB was 'dirtied', in which case it must
write it back into the memory before the next current request could be
proceed. Being dynamic RAMs, they must be refreshed (logic not shown)
so as not to lose the data."
Figure 11. The RTPP buffer memory control logic (reproduced with
permission from J. Histochem. Cytochem.
[4], 1974). "Each
buffer memory is an asynchronous device that received I/O requests
either from the general picture process (GPP) or the Quantimet for
input or output. Given a request and an address, it first checked to
see whether the last (high order 14-bit address) four-word buffer
accessed was the same as that for the current request. If so, it did
not have to do another memory (RAM) cycle and the signal OLDBWB signal
is 'true'. When a read cycle occurred and a different FWB was needed,
it checked to see if the FWB was 'dirtied', in which case it must
write it back into the memory before the next current request could be
proceed. Being dynamic RAMs, they must be refreshed (logic not shown)
so as not to lose the data."
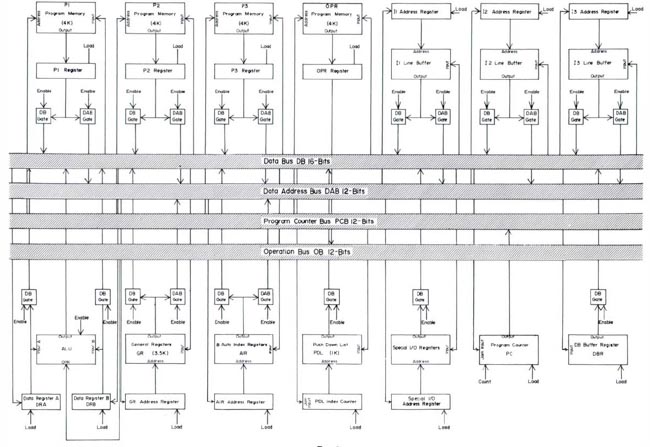 Figure 12. The RTPP general picture processor (GPP) bus structure
(reproduced with permission from J. Histochem. Cytochem.
[4],
1974). "The instruction addressing sequence is done serially. That is,
Pi is addressed, then P2, then P3. Let 'c(.)' denote 'contents of
current memory location'. If any address is immediate, no memory fetch
is done. Rather, the PM data, c(P), is enabled onto the data bus
DB. If direct addressing mode c(c(P)) is used, the PM data c(P) is
enabled onto the data address bus, DAB, and then loaded onto the
appropriate data field address register. The memory then enables its
data, c(c(P)), onto the data base, DB. If indirect mode is used then
the same sequence is repeated as for direct mode, but c(c(P)) is
enabled back onto the DAB instead of the DB. Then the data address
field register addressed is loaded and the c(c(c(P))) from that memory
is enabled onto the DB. A conflict may occur in the use of the
indirect mode from the 'MOVE' instruction. This is resolved by storing
the source data in the data bus register, DBR, temporarily. Various
devices and memories are connected to the bus structure and interact
when the control section activates them. The average GPP instruction
time is designed to be on the order of 250 nanoseconds." (Click on
this figure to bring up the high-resolution version of the figure. You
may have to make your browser window larger.)
Figure 12. The RTPP general picture processor (GPP) bus structure
(reproduced with permission from J. Histochem. Cytochem.
[4],
1974). "The instruction addressing sequence is done serially. That is,
Pi is addressed, then P2, then P3. Let 'c(.)' denote 'contents of
current memory location'. If any address is immediate, no memory fetch
is done. Rather, the PM data, c(P), is enabled onto the data bus
DB. If direct addressing mode c(c(P)) is used, the PM data c(P) is
enabled onto the data address bus, DAB, and then loaded onto the
appropriate data field address register. The memory then enables its
data, c(c(P)), onto the data base, DB. If indirect mode is used then
the same sequence is repeated as for direct mode, but c(c(P)) is
enabled back onto the DAB instead of the DB. Then the data address
field register addressed is loaded and the c(c(c(P))) from that memory
is enabled onto the DB. A conflict may occur in the use of the
indirect mode from the 'MOVE' instruction. This is resolved by storing
the source data in the data bus register, DBR, temporarily. Various
devices and memories are connected to the bus structure and interact
when the control section activates them. The average GPP instruction
time is designed to be on the order of 250 nanoseconds." (Click on
this figure to bring up the high-resolution version of the figure. You
may have to make your browser window larger.)
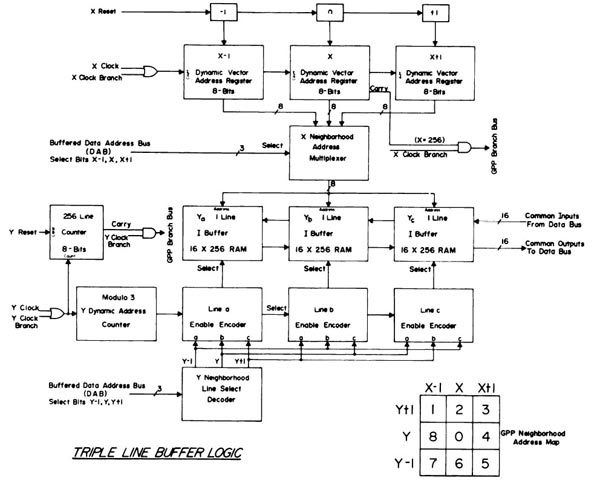 Figure 13. The RTPP triple line buffer logic (reproduced with
permission from J. Histochem. Cytochem.
[4], 1974). "The RTPP was
designed to do 3x3 neighborhood image-processing in parallel in the
GPP. Associated with the three lines is an effective Y dynamic address
used to order the three lines as to (Y-1,Y,Y+1). In reading a raster
line pattern into the triple line buffer, the oldest line must be
replaced with the newest line. Similarly, the other two lines need to
be adjusted as (Y-1,Y,Y+1) to (Y,Y+1,Y+2). By selecting the effective
line address with a modulo three dynamic Y address counter, a dynamic
Y address can be implemented. This is similar to the concept of
buffer. The three X dynamic address vectors point to 3x3 neighborhood
arrays in the line buffer. This neighborhood is called the current
neighborhood. All of the dynamic address vectors are easily and
efficiently programmed in the GPP to tessellate the current
neighborhood along the three lines in the line buffer."
Figure 13. The RTPP triple line buffer logic (reproduced with
permission from J. Histochem. Cytochem.
[4], 1974). "The RTPP was
designed to do 3x3 neighborhood image-processing in parallel in the
GPP. Associated with the three lines is an effective Y dynamic address
used to order the three lines as to (Y-1,Y,Y+1). In reading a raster
line pattern into the triple line buffer, the oldest line must be
replaced with the newest line. Similarly, the other two lines need to
be adjusted as (Y-1,Y,Y+1) to (Y,Y+1,Y+2). By selecting the effective
line address with a modulo three dynamic Y address counter, a dynamic
Y address can be implemented. This is similar to the concept of
buffer. The three X dynamic address vectors point to 3x3 neighborhood
arrays in the line buffer. This neighborhood is called the current
neighborhood. All of the dynamic address vectors are easily and
efficiently programmed in the GPP to tessellate the current
neighborhood along the three lines in the line buffer."
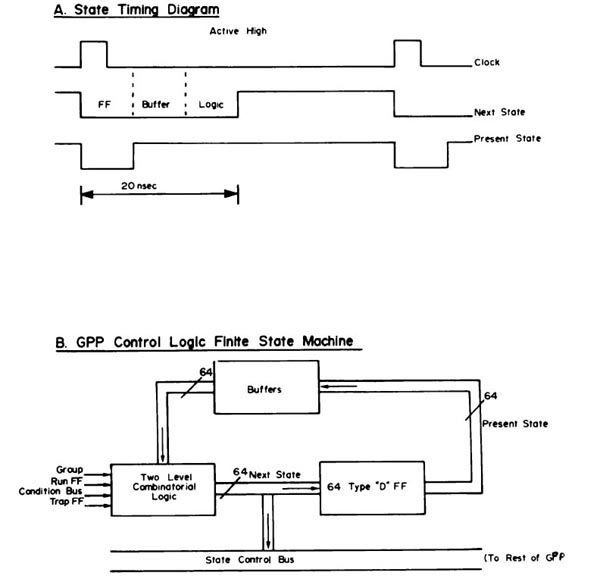 Figure 14. The RTPP GPP control logic finite state machine (reproduced
with permission from J. Histochem. Cytochem.
[4], 1974). "The
GPP control logic is implemented as a finite state machine where the
states of the system are defined from the logic flow of the
system. This consists of the various bus, register enable and load
signals. The state is a function of the current state and the current
operator. Thus, to extend the machine, additional states and
transitions between states would have been added (see
[TR-7,TR-22])."
Figure 14. The RTPP GPP control logic finite state machine (reproduced
with permission from J. Histochem. Cytochem.
[4], 1974). "The
GPP control logic is implemented as a finite state machine where the
states of the system are defined from the logic flow of the
system. This consists of the various bus, register enable and load
signals. The state is a function of the current state and the current
operator. Thus, to extend the machine, additional states and
transitions between states would have been added (see
[TR-7,TR-22])."
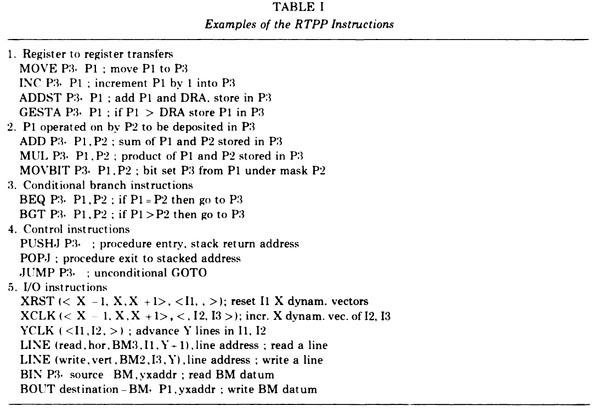 Figure 15. The Examples of RTPP instructions for the GPP (reproduced
with permission from J. Histochem. Cytochem.
[4], 1974). The Pi
refers to a 3x3 pixel neighborhood that would be tessellated through
the entire image. The GPP instructions [A HREF="#TR-22">TR-22] could be
compiled by the GPPASM [A HREF="#TR-16">TR-16] assembler program running on
the PDP8e and then loaded into the GPP instruction memory. A debugger for the
GPP was DDTG that ran on the PDP8e [A HREF="#TR-2">TR-2] but controlled the
GPP and buffer memories. We had also been evaluating collaborating on the
construction of a MAINSAIL(R)
compiler to generate GPP assembly code so we could program the RTPP in
a SAIL-like language.
back to top of section
Figure 15. The Examples of RTPP instructions for the GPP (reproduced
with permission from J. Histochem. Cytochem.
[4], 1974). The Pi
refers to a 3x3 pixel neighborhood that would be tessellated through
the entire image. The GPP instructions [A HREF="#TR-22">TR-22] could be
compiled by the GPPASM [A HREF="#TR-16">TR-16] assembler program running on
the PDP8e and then loaded into the GPP instruction memory. A debugger for the
GPP was DDTG that ran on the PDP8e [A HREF="#TR-2">TR-2] but controlled the
GPP and buffer memories. We had also been evaluating collaborating on the
construction of a MAINSAIL(R)
compiler to generate GPP assembly code so we could program the RTPP in
a SAIL-like language.
back to top of section
7. Applications of the RTPP in Biomedical Research
We describe a few of the main applications that used the Real Time
Picture Processor to give a little flavor of its utility. Other
projects are referred to in some of the lists of journal articles, technical reports, and in the list of RTPP users
towards the end of this article.
Description of optical microscope applications
Lewis Lipkin was working on the cellular effects of asbestos fibers on
the induction of pleural sarcoma
[10]. Lew developed a culture system
that used a macrophage-like P388D1 tissue cell line to study the
effect of asbestos fibers on cells. Asbestos fibers were cytotoxic to
the P388D1 macrophages in tissue cultures. A microscope system was
used to take photographs of samples over multiple days to study
fiber-induced cytotoxicity for a range of asbestos and related fibers
as in Figure
16. On incubation, the colonies lost numbers of cells, and giant
cells occurred in places. In addition, significant changes occurred
in cell morphology. Marta Wade, the technician who ran the
cell-lines, shot time-lapse photographs of the cells with various
types of asbestos fibers. This type of data was among the first
candidates for use with the RTPP image-capture system using both phase
contrast and differential interference optics on the Zeiss Axiomat
microscope. We also used this tissue culture system to when analyzing
protein differences of these samples with 2D gels
[9]. One of the
offshoots of this work was to measure the uniformity of cell-boundary
adherence using hundreds of images gathered in 15-second
intervals. These were analyzed with the boundary trace transform (BTT)
[8, 9] illustrated in Figure
17.
Serial sectioning of Anolus brain
Another of the projects Lew and I were also working on was the
construction of a 3D brain atlas of an anolus lizard brain
using aligned microtomed serial-section images. (Some of the goals for
that project were similar to that of the National Library of
Medicine's
Visible Human. However, this was well before adequate computer
technology and resources were available to implement such an atlas.)
We wrote a PDP8e program to move the optical microscope stage in (X,Y)
while keeping the center of the brain in the scanned visual center of
the image field as we switched slides in a series of microtomed serial
sections (the Z-axis control was not used in this operation). Each
centered image could then be captured and saved as a disk file. The
next section visible on the TV camera was compared with the image
previously captured and stored in the image buffer memory. This
procedure was iteratively repeated with subsequent slides to capture a
sequence of aligned serial sections from a set of slides. The buffer
memory data was saved at each point on 9-track magnetic tape. (This
alignment software subsequently led to our involvement with 2D
electrophoretic gels analysis [discussed below].) The set of serial
sections could then be re-accessed sequentially to step through the
brain slices centered at the selected point. We could generate movie
loops with the BMON2 software to move virtually up and down through
the serial sections at various frame rates. Because we could store
sixteen 256x256 images in the buffer memory, the loops could have up
to 16 sections and allowed us to visualize the 3D structure of part of
the brain.
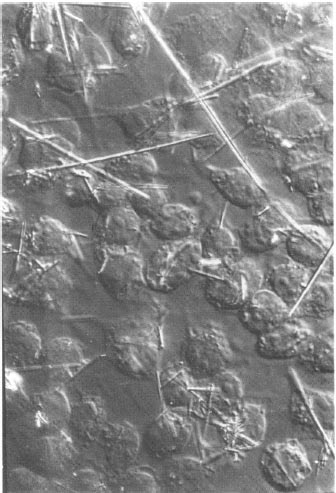 Figure 16. Photomicrograph of P388D1 macrophage-like cells 24 hours
after amosite asbestos treatment used to study fiber-induced
cytotoxicity [9] (reproduced with permission from
Environmental Health Perspectives, 1980).
Figure 16. Photomicrograph of P388D1 macrophage-like cells 24 hours
after amosite asbestos treatment used to study fiber-induced
cytotoxicity [9] (reproduced with permission from
Environmental Health Perspectives, 1980).
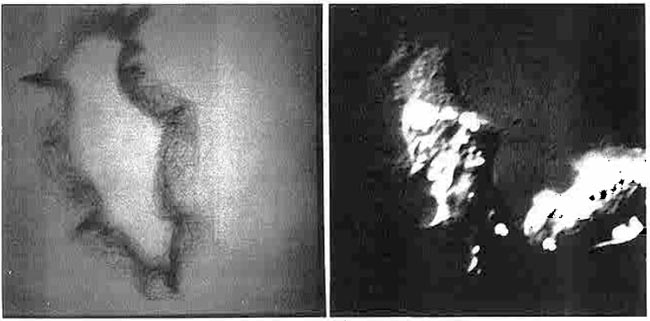 Figure 17. (Left) Boundary trace transform (BTT) of 233 images of
15-second interval scans of a single living P388D1 macrophage-like
cell (left) (reproduced with permission from
Environmental Health Perspectives, 1980 [9]).
The boundaries
for this set of images were traced by hand using a graphics tablet
connected to the RTPP. The BTT is a 2D boundary frequency histogram
where darker (higher frequency) pixels indicate boundaries of the cell
that are more adherent to the glass slide and have less motility.
BMON2 captured the set of images data and double buffered them to
9-track magnetic tape, with a 15-second image-sampling interval
between scans. (Right) Illustration of a single cell captured by the
RTPP using differential interference optics. The algorithm is
described in several papers [8,
9].
Movies were made on the RTPP of a
subsequence of 16 of the images in which you could see the cell trying
to ingest the fiber, the fiber breaking through the other side of the
cell (membrane), and then the cell backing up to try to reingest that
part of the fiber, etc. These images allowed us to create a
probability distribution of adhesion strength for boundary points of
amoeboid cells. Points with low probability would flutter and
extend. Looking at individual boundaries would not reveal this type of
information; it was the ability to integrate large quantities of data
that allowed these patterns to be detected. This was the way we
thought the system should have been used - finding interesting
results when no other method for doing so was possible.
back to top of section
Figure 17. (Left) Boundary trace transform (BTT) of 233 images of
15-second interval scans of a single living P388D1 macrophage-like
cell (left) (reproduced with permission from
Environmental Health Perspectives, 1980 [9]).
The boundaries
for this set of images were traced by hand using a graphics tablet
connected to the RTPP. The BTT is a 2D boundary frequency histogram
where darker (higher frequency) pixels indicate boundaries of the cell
that are more adherent to the glass slide and have less motility.
BMON2 captured the set of images data and double buffered them to
9-track magnetic tape, with a 15-second image-sampling interval
between scans. (Right) Illustration of a single cell captured by the
RTPP using differential interference optics. The algorithm is
described in several papers [8,
9].
Movies were made on the RTPP of a
subsequence of 16 of the images in which you could see the cell trying
to ingest the fiber, the fiber breaking through the other side of the
cell (membrane), and then the cell backing up to try to reingest that
part of the fiber, etc. These images allowed us to create a
probability distribution of adhesion strength for boundary points of
amoeboid cells. Points with low probability would flutter and
extend. Looking at individual boundaries would not reveal this type of
information; it was the ability to integrate large quantities of data
that allowed these patterns to be detected. This was the way we
thought the system should have been used - finding interesting
results when no other method for doing so was possible.
back to top of section
Use of the RTPP for 2D gel electrophoresis
In about 1977, Carl Merril of the National Institutes of Mental Health
(NIMH) had a problem. He was working with 2-dimensional (2D) gel
electrophoresis to determine protein shifts in
E.coli amber mutant cultures. However, just overlaying the gels
on a light box did not show the differences very well, and he knew a
difference should show up in the (MW, pIe) range of the gels. We had
constructed a rudimentary flicker comparison program for acquiring
aligned serial sections (describe above). A mutual friend, who played
ping-pong with Carl, suggested that he contact us because we had this
new system to do image processing. We jury-rigged the RTPP with a
vidicon camera that could scan the 2D gel image using a 35 mm camera
lens using the program we had developed to flicker align the anolus
brain. The program kept the image just scanned in the buffer
memory and the other was in the active video. By alternating one image
against the other (i.e., flickering, similar to what we did in
aligning
anolus brain serial sections), we were able to immediately see
the amber mutant proteins. Spots had shifted across to the other side
of the gel, which is why their detection eluded simple
observation. Part of this observation discovered in the gel
differences was later validated in wet-lab experiments. At that
point, we started developing a series of programs starting with the
original FLICKER program reported in [13]
and later leading to the
GELLAB-I system (i.e., GEL LABoratory for exploratory data analysis).
The FLICKER software allowed users to measure spots as a set of (X,Y)
image positions and integrated-densities for each sample. We manually
recorded this data for later analysis, manually defining spots to be
corresponding if they aligned well with FLICKER.
back to top of section
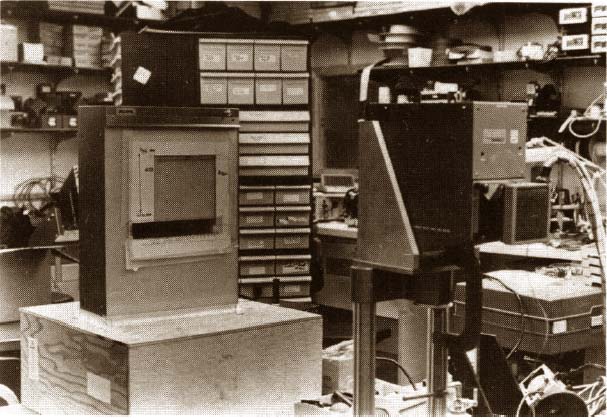 Figure 18. This was the alternative image acquisition
setup. (Reproduced from a figure with permission from a reprint from
Environmental Health Perspectives, 1980 [9].)
A high-quality
uniform illumination Aristo light box and Quantimet Vidicon TV camera
were used for non-microscope images. A gel autoradiograph, wet 2D gel,
electron micrograph, or other transparent sample object was placed on
the light box and scanned using the RTPP/Vidicon camera. A NBS
standard neutral density step wedge was placed on the bottom of the
scan area. This was captured along with the image and was used to
calibrate the grayscale pixel data to optical density using a
piecewise linear curve fitting algorithm (see [9]
for an example). As
an aside, the electronics workbench area in the background was where
many of the local RTPP electronics assembly was performed in the Park
Building.
Figure 18. This was the alternative image acquisition
setup. (Reproduced from a figure with permission from a reprint from
Environmental Health Perspectives, 1980 [9].)
A high-quality
uniform illumination Aristo light box and Quantimet Vidicon TV camera
were used for non-microscope images. A gel autoradiograph, wet 2D gel,
electron micrograph, or other transparent sample object was placed on
the light box and scanned using the RTPP/Vidicon camera. A NBS
standard neutral density step wedge was placed on the bottom of the
scan area. This was captured along with the image and was used to
calibrate the grayscale pixel data to optical density using a
piecewise linear curve fitting algorithm (see [9]
for an example). As
an aside, the electronics workbench area in the background was where
many of the local RTPP electronics assembly was performed in the Park
Building.
The manual recording of (gel,X,Y,intensity) data quickly became
tedious and error prone as we increased the numbers of gels and
numbers of spots measured. This led to an effort to automate the
process. A spot segmenter was implemented on the PDP8e which used some
of the image memories to store intermediate computations. Most of the
time this process worked well, but occasionally a bit would be dropped
in an image memory and the program would hang. A spot-pairing method
was also implemented on the PDP8e. Around this time, the
DECsystem-2020 interface became operational and the software was
rewritten in SAIL (Stanford Artificial Intelligence Language) on the
more robust DECsystem-2020 software system and became part of the
GELLAB-I system [13,
14,
15,
16,
17,
18,
19,
20,
21,
22,
23,
24,
25,
26,
27,
28,
29,
30,
31,
32].
The RTPP became a "front-end" for image
processing software running on the DECsystem-2020, becoming a slave
processor of the software on the DECsystem-2020. The GELLAB-I software
then did data acquisition and interactive spot landmarking via the
RTPP/BMON2 and subsequent higher level data analysis on the
DECsystem-2020.
Eric Lester, M.D. (an oncologist in an NCI postdoctoral program with
Dr. Herbert Cooper, Ph.D. in the Laboratory of Pathology of NCI) was one of
the early users of the system after our initial work with Carl
Merril. Eric was starting to use 2D gels to look at changes in human
lymphocytes. Eric painstakingly used the FLICKER program to select and
measure integrated density (by drawing circles around the spots and
doing background subtraction) for about 20 spots/gel for a large
number of gels. Large numbers of spots and sample gels were required
to begin to see protein expression patterns statistically associated
with experimental conditions. However, in addition to seeing patterns,
Eric saw circles when he went home at night from this intense labor.
It became apparent that we needed to perform statistics on this data -
a key insight. Because the manual data gathering for large numbers of
spots was a "one-postdoc" type of experiment, we realized we had to
automate the spot quantification. That was when I developed the 2D
gel spot segmenter program on the RTPP/PDP8e that could give the list
of all quantified spots in a gel image (described in the above
paragraph).
Eric painstakingly generated paired data for about 1,400 spots from
the segmented images and their paired spot lists for a few gels.
Because of the difficulty in matching or pairing spots between gels, I
also developed spot-pairing and spot "landmarking" programs, which ran
interactively on the RTPP/PDP8e. (Landmarking is visually identifying
a set of spots that are common in both the reference gel and each
additional gel sample so spot pairing could proceed.) Eric then
subjected the data to SPSS
statistical
analysis with encouraging results (t-Tests, Spearman correlation,
ANOVA) and it was published in [14] and enhancements in
[15,18-21]. All three of these programs were rewritten in SAIL for the
DECsystem-2020. At this point we realized that we wanted to build a
database containing large numbers of gels to detect marker proteins or
classify samples by protein pattern signatures indicating states of
differentiation, disease conditions, or other experimental
conditions. This was the basis of GELLAB-I.
This led to the SAIL program CGELP, in GELLAB-I, to construct a
composite gel database with a virtual reference gel [14-18,20,30] and
the addition of many more statistical methods. (The subsequent Unix
version was called CGELP2
[30,
42,
43,
44,
45]
where additional statistical
exploratory data analysis methods were added - see [history
of GELLAB
].)
Spots of a set of N-1 gels would be matched to one of
the gels called a reference gel and spots missing in the physical
reference gel would be extrapolated into the reference gel. Figure 19
shows the reference gel 324.1 that was an acute myeloid leukemia (AML)
gel, scanned with the RTPP. This reference gel was used in many of the
leukemia databases to tie the data together
[14,
15,
16,
17,
18,
22].
The
collection of SAIL programs, as well as their RTPP interface, was
called GELLAB-I. After leaving NIH (for the University of Chicago),
Eric would fly back to work in our laboratory to do marathon
late-night landmarking sessions to help generate these databases of
large numbers of 2D leukemia gels. Over the years, we had built
various databases with over 400 gel samples. The leukemia database had
over 130 samples. Some of these gel sample images are available on the
bioinformatics.org/lecb2dgeldb
open source repository. This early
research led to my interest in exploratory data analysis and future
work with microarrays with MAExplorer.sourceforge.net
[46], and proteomics exploratory data analysis using open2dprot.sourceforge.net
.
Peter Sonderegger, while a post-doc at the National Institute of Child
Health and Development (NICHD), used the GELLAB-I system with the RTPP
to investigate how the expression of axonal proteins of sensory and
motor neurons was influenced by non-neuronal cells
[27,
29,
45].
At the same time we were investigating the feasibility of porting GELLAB-I
(written in SAIL) to the PASCAL computer language. The inflexibility
of PASCAL eventually led us to convert GELLAB-I to the portable
C/UNIX/X-windows environment called GELLAB-II
[42,
43,
44,
45]
The DECsystem-10 SAIL version, GELLAB-I, was exported to research labs at
Univ. of Chicago (Eric Lester) and Univ. of Kiel (Heinz Busse). The
Unix version, GELLAB-II, was exported to a number of research labs
around the world (CDC with Jim Myrick [44],
Univ. Zurich with Peter Sonderegger, Agr. Univ. Norway with Trygve Krekling,
and others) and led to a commercial subset version for Windows PCs called GELLAB-II++
by CSPI/Scanalytics.
 Figure 19. One of the early 2-dimensional (2D) gels scanned with the
vidicon/RTPP system (leukemia AML sample number 324.1 - a 2D-gel
autoradiograph scanned to a 512x512 8-bit image) in a collaboration
with Eric Lester (NCI oncologist at the time), Lewis Lipkin, and
myself with the GELLAB-I system
[14,
15,
16,
17,
18,
22].
The film was scanned on a
light box (shown in Figure 18 above) along with a neutral-density step
wedge at the top so the grayscale image data could be mapped to
optical density, resulting in a more linear calibration with protein
concentration in the 2D gel. The leukemia gels are part of a public 2D
gel database at
http://bioinformatics.org/lecb2dgeldb
.
back to top of section
Figure 19. One of the early 2-dimensional (2D) gels scanned with the
vidicon/RTPP system (leukemia AML sample number 324.1 - a 2D-gel
autoradiograph scanned to a 512x512 8-bit image) in a collaboration
with Eric Lester (NCI oncologist at the time), Lewis Lipkin, and
myself with the GELLAB-I system
[14,
15,
16,
17,
18,
22].
The film was scanned on a
light box (shown in Figure 18 above) along with a neutral-density step
wedge at the top so the grayscale image data could be mapped to
optical density, resulting in a more linear calibration with protein
concentration in the 2D gel. The leukemia gels are part of a public 2D
gel database at
http://bioinformatics.org/lecb2dgeldb
.
back to top of section
Use of the RTPP for RNA secondary structure analysis
In the mid 1970s, Jacob Maizel (who later became chief of the
Laboratory of Experimental and Computational Biology) visited the
Image Processing Unit (IPU) carrying a set of electron micrographs of
RNA molecules. While in the National Institute of Child Health and
Development (NICHD), Jake had been using an early Hewlett Packard
computer to manually trace the RNA molecules in the electron
micrographs to determine the repetitive nature of features that were
visible in these images. The traces, called secondary structure maps,
indicated where double- and single-stranded regions occurred in the
RNA. Knowledge of these regions is important for understanding RNA
folding, which in turn is related to RNA's function. This manual task
was tedious and Jake wondered whether the image processing hardware
and software associated with the RTPP could be used to help generate
secondary structure maps automatically. The RTPP was used to scan and
preprocess some of these electron micrograph images
[33,
34]
that were
input for this type of analysis. At the same time, Bruce had
developed the circle transform [35]
for biological shape description
for describing cell mitosis with Lew and had published with Dr. Jack
Sklansky, Ph.D.
[37,
38],
who was doing a sabbatical in the IPU at the time.
Bruce became interested in the RNA folding problem after working on
these shape descriptors for the cellular image domain.
This work led to a series of programs that were able to analyze
digital images of the electron micrographs (see Figure 20) by applying
algorithms such as shade correction to reduce background noise
irregularities, notch filtering, and segmentation to extract the
shapes of the individual molecules. The circle transform was then
applied to these shapes to produce secondary structure maps [39].
They produced several papers
[47,
48,
49,
50,
TR-472] as well as Bruce's
Ph.D. dissertation [TR-BAS78]
under Azriel Rosenfeld at the University
of Maryland. Bruce went on to do research on other aspects of RNA
structure and function (see
www.ccrnp.ncifcrf.gov/~bshapiro), including the use of RNA in
nanobiology.
Partly as a result of this collaboration, Jake became more interested
in computing, which led him to purchase one of the early DEC VAX
computers for his lab. As Jake became more involved with computational
techniques, he realized the general importance, as did Lew, of using
computers in biology. Eventually, this interest culminated with the
National Cancer Institute's purchase of a Cray XMP supercomputer, and
the establishment of what is today the Advanced Biomedical Computer
Center in Frederick. The Cray XMP, at that time, was the first
supercomputer in the world solely dedicated to biomedical
research. Thus, the impact of the RTPP continues to be felt in the
biological computation sciences 30 years later.
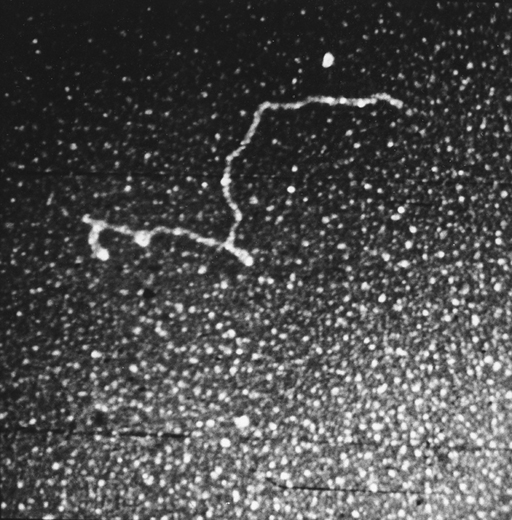 Figure 20. One of the early RNA electron micrographs scanned with the
vidicon/RTPP system (Jacob Maizel, Bruce Shapiro, and Lewis Lipkin)
[33,
34,
39,
48,
49].
The sample was adenovirus type 2 messenger
RNA. Bruce developed boundary segmenters and boundary shape
descriptors that could map electron micrograph data to the secondary
structure.
back to top of section
Figure 20. One of the early RNA electron micrographs scanned with the
vidicon/RTPP system (Jacob Maizel, Bruce Shapiro, and Lewis Lipkin)
[33,
34,
39,
48,
49].
The sample was adenovirus type 2 messenger
RNA. Bruce developed boundary segmenters and boundary shape
descriptors that could map electron micrograph data to the secondary
structure.
back to top of section
8. Discussion of What We Learned
The Real Time Picture Processor (RTPP) project occurred during that
window of time when electronics were providing giant leaps forward in
the ability to analyze data stored or collected by medical
researchers. Prior to this, it would have been very difficult to
collect, let alone analyze, the vast amounts of data it is now
possible to acquire with new digital technology. This phase
encompassed a major shift from analog to digital technology. There was
also a shift to use combined hardware and software systems as part of
the solution to these problems. Subsequently, as computers became
faster, the solutions shifted again from mostly hardware-focused
systems to those more software-based systems using less expensive but
much more powerful computers becoming available. We were a part of
the new digital frontier, making new digital imaging technology
available to biomedical collaborators and then collectively devised
new ways of look at this data. The tight feedback loop between
developers and users was critical for discovering how these new
digital imaging technologies could be used.
It should be emphasized that the RTPP was an evolving enterprise that
met real demands as it grew. It wasn't constant in nature and various
functions were appended as we applied it to real problems. The RTPP
grew because of the intellectual demand of the people using it, and it
had a biological bias because Lew Lipkin was a biologist. It did not
start out as the RTPP, but rather as the idea that a microscope slide
was a sort of random access memory. Lew Lipkin's concept that the
slide was an information resource was the driving force for this
research. He called the list of cell positions the "pick-list" (since
the biologist picked them). There were many extensions to this concept
along the way. For example, one could sample a set of picked-out cells
in a tissue culture and make periodic measurements over time by
returning to them in a random-access manner.
In our experience, we found that you can't always design everything
100 percent from the beginning. You have to experiment, try things,
and then let the project grow based on what works and what is
needed. Having the flexibility to follow new ideas made the
development of a functioning buffer image memory subsystem
possible. And you have to just throw things away. You have to
superannuate them or do new things with them. You don't have to throw
things out necessarily, but replace them in an intelligent way in
response to the biological research needs. You need enough flexibility
in your environment to allow things to grow without having to get
permission each time to try something new. It is analogous to a
working in a kitchen where you don't know which utensil you will need
to use at any particular time. Nobody builds a kitchen with just one
knife and spoon.
The automated microscopes, the large image memories, the digital
compute power, the fast and high-resolution grayscale display, and the
flexible digital user controls all grew as they were needed. At the
time, we were fortunate that Lew was able to obtain enough NCI support
to allow us to judiciously replace some pieces of equipment that were
no longer extendable for the project's goals. Having these resources
meant that if we thought of something we needed to build to make the
next research step possible, we could begin almost immediately to move
ahead because we had the capacity to do so.
We were at the transition from analog solutions to problems to using
the new exciting digital methods. We were convinced that anything we
wanted to be computed in hardware could be done by a minimum series of
hardware gates and finite state machines. George, in particular, was
convinced about circuit diagrams being proper and algebraically
correct, and that they could be designed and validated using Karnaugh
Maps and related computer design tools. We had experienced this with
the grain counter so we knew that we could implement complex
sequential computational ideas in hardware (as we had done in tracking
the grain XY coordinates). The grain counter was the test bed. At
that time, we knew what the grain counter would do. What the image
memories could do were still a dream at that point, but we had the
confidence to attempt building the RTPP. Stretching the envelope made
a real difference in the productivity of analyzing real data with
powerful algorithms.
Applying new digital imaging methods to biological problems was the
way we thought the system should have been used. This let us find
interesting results when no other method to do so was available at
that time.
The major contributing factor to the success of this project was the
great management that Lew Lipkin exhibited. He assembled a group of
skilled individuals, fostered communication, encouraged the sharing of
information and credit between them with group ownership, and
supported the group so that they could get the job done. He collected
the right people and trusted them. Bruce Shapiro and I applied what
we were learning about image processing and computer science at the
University of Maryland to the RTPP design. George Carman brought what
he had just learned for his masters in computer hardware architecture
about using microprogramming coding to implement flexible hardware
designs. Lew was unique in that he understood and could communicate in
the jargon of each of these areas. Everyone cooperated, helping
everyone else where they could - constantly encouraged by Lew Lipkin's
leadership and intellectual curiosity. With this positive
communication between us, we made great progress and helped lead the
way in automated cytology. It was quite an exciting time.
back to top of section
9. Acknowledgements
This history was compiled by myself (Peter Lemkin) with interviews,
recollections, and content from Lewis Lipkin, George Carman, Bruce
Shapiro, and Morton Shultz and some of the users (Carl Merril, Peter
Sonderegger, Eric Lester). This article could not have been done
without everyone's input. Thanks to my wife, Ellen Burchill, for
assistance with the editing; Michelle Lyons, the Museum Curator, for
helping with accessioning and editing; and to Maritta Grau's Frederick
Scientific Publications group for editing suggestions. Any errors of
omission or commission in this history are the responsibility of
myself and of time. Memories tend to fade as the years pass. We
attempted to reconstruct the history as best we could using additional
information in papers, files, notes, technical reports, and
interviews. We thank the journals that have opened their archives to
free public access to old papers.
Since many of the companies and products mentioned in this article
have disappeared, we found historical links on the Internet that were
useful for providing the context in which to understand this project.
When the history was completed, it was donated to the Museum of NIH in
the Office of NIH History
(http://history.nih.gov/) for
use as part of their permanent online exhibits. We also wish to thank
them for their help. A buffer memory image board from the original
RTPP, selected papers and technical reports illustrating the design
were also donated as artifacts. Many of the papers are available as
PDF links to the journals, and most of the technical reports are
available as downloadable PDF files in the References section of this Web site. The
Office of NIH History has permanent exhibits as well as
access to these artifacts.
back to top of section
10. References to Papers and Technical Reports for the RTPP
The references are divided into journal articles and technical
reports. Where it is possible, we provide links to the PDFs for open
access from some of the journals as well as downloadable PDFs for most
of the technical reports. The original technical report numbering is
used in this history.
Journals:
1.
Lipkin, L.E., Watt, W.C., Kirsch, R.A.: The analysis, synthesis,
and description of biological images. Ann N Y Acad Sci.
128(3): 984-1012, 1966.
2.
Lipkin, L.E., Lemkin, P.F., Carman, G.: Automated
autoradiographic grain counting in human determined context.
J. Histochem. Cytochem. 22(7): 755-765, 1974.
(PDF
)
3.
Lemkin, P.F., Carman, G., Lipkin, L., Shapiro, B., Schultz, M.,
Kaiser, P.: A real time picture processor for use in biologic cell
identification. I. System design. J. Histochem. Cytochem. 22(7):
725-731, 1974.
(PDF
)
4.
Carman, G., Lemkin, P.F., Lipkin, L., Shapiro, B., Schultz, M.,
Kaiser, P.: A real time picture processor for use in biologic cell
identification. II. Hardware implementation.
J. Histochem. Cytochem. 22(7): 732-740, 1974.
(PDF
)
5.
Shapiro, B., Lemkin, P.F., Lipkin, L.: The application of
artificial intelligence techniques to biologic cell identification.
J. Histochem. Cytochem. 22(7): 741-750, 1974.
(PDF
)
6.
Schultz, M.L., Lipkin, L.E., Wade, M.J., Lemkin, P.F., Carman,
G.M.: High resolution shading correction.
J. Histochem. Cytochem. 22(7): 751-754, 1974.
(PDF
)
7.
Shapiro, H.M., Bryan, S.D., Lipkin, L.E., Stein, P.G., Lemkin,
P.F.: Computer-aided microspectrophotometry of biological
specimens. Exp Cell Res. 67(1): 81-89, 1971.
8. Lemkin, P.F.: The boundary trace transform: An edge and region
enhancement transform. Comp. Graphics Image Processing 9:
150-165, 1979.
9.
Lemkin, P.F., Lipkin, L., Merril, C., Shiffrin, S.: Protein
abnormalities in macrophages bearing asbestos. Environ. Health
Perspect. 34: 5-89, 1980.
(PDF)
10.
Lipkin, L.E.: Cellular effects of asbestos and other fibers:
correlations with in vivo induction of pleural sarcoma.
Environ. Health Perspect. 34:91-102, 1980. (PDF)
11. Lemkin, P.F.: An approach to region splitting. Comp. Graphics
Image Processing 10: 281-288, 1979.
12.
Lemkin, P.F., Lipkin, L.: Use of the positive difference transform
for RBC elimination in bone marrow smear images. Anal.
Quant. Cytol. 1(1): 67-76, 1979.
13.
Lemkin, P.F., Merril, C., Lipkin, L., Van Keuren, M., Oertel, W.,
Shapiro, B., Wade, M., Schultz, M., Smith, E.: Software aids for
the analysis of 2D gel electrophoresis images.
Comput. Biomed. Res. 12: 517-544, 1979.
14.
Lester, E.P., Lemkin, P.F., Cooper, H.L., Lipkin, L.E.:
Computer-assisted analysis of two-dimensional electrophoresis of
human peripheral blood lymphocytes. Clin. Chem. 26: 1392-1402,
1980. (PDF
)
15.
Lipkin, L.E., Lemkin, P.F.: Data base techniques for multiple
PAGE (2D gel) analysis. Clin. Chem. 26: 1403-1413, 1980.
(PDF
)
16.
Lemkin, P.F., Lipkin, L.: GELLAB: A computer system for 2D gel
electrophoresis analysis. I. Segmentation and preliminaries.
Comput. Biomed. Res. 14: 272-297, 1981.
17.
Lemkin, P.F., Lipkin, L.: GELLAB: A computer system for 2D gel
electrophoresis analysis. II. Spot pairing.
Comput. Biomed. Res. 14: 355-380, 1981.
18.
Lemkin, P.F., Lipkin, L.: GELLAB: A computer system for 2D gel
electrophoresis analysis. III. Multiple gel analysis.
Comput. Biomed. Res. 14: 407-446, 1981.
19. Lester, E.P., Lemkin, P.F., Lipkin, L.E.: New dimensions in
protein analysis - 2D gels coming of age through Image Processing.
Anal. Chem. 53: 390A-397A, 1981.
(PDF)
20.
Lester, E.P., Lemkin, P.F., Lipkin, L.E., Cooper, H.L.: A
two-dimensional electrophoretic analysis of protein synthesis in
resting and growing lymphocytes in vitro. J. Immunol. 126:
1428-1434, 1981.
21.
Lemkin, P.F., Lipkin, L.E., Lester, E.P.: Some extensions to the
GELLAB 2D electrophoresis gel analysis system. Clin. Chem. 28:
840-849, 1982.
(PDF
)
22.
Lester, E.P., Lemkin, P.F., Lipkin, L.E.: A two-dimensional
gel analysis of autologous T and B lymphoblastoid cell lines.
Clin. Chem. 28: 828-839, 1982.
(PDF
)
23. Lester, E.P., Lemkin, P.F., Lowery, J.F., Lipkin, L.E.:
Human leukemias: A preliminary 2D electrophoretic analysis.
Electrophoresis 3: 364-375, 1982.
24. Howard, R.J., Aley, S.B., Lemkin, P.F.: High resolution comparison
of Plasmodium Knowlesi clones of different variant antigen
phenotypes by 2D gel electrophoresis and computer analysis.
Electrophoresis 4: 420-427, 1983.
25. Lemkin, P.F., Lipkin, L.E.: 2D Electrophoresis gel data base
analysis: Aspects of data structures and search strategies in
GELLAB. Electrophoresis 4: 71-81, 1983.
26. Lester, E.P., Lemkin, P.F., Lipkin, L.E.: States of
differentiation in leukemias: A 2D gel analysis. In Rowley,
J. D. and Ultmann, J. E. (Eds.): Proceedings of 5th Annual Bristol
Myers Symposium on Cancer Research. Chromosomes and Cancer: From
Molecules to Man. New York, Academic Press, 1983,
pp. 226-245.
27.
Lemkin, P.F., Sonderegger, P., Lipkin, L.: Identification of
coordinate pairs of polypeptides: A technique for screening of
putative precursor product pairs in 2D gels. Clin. Chem. 30:
1965-1971, 1984.
(PDF
)
28.
Lester, E.P., Lemkin, P F., Lipkin, L.E.: Protein indexing
in leukemias and lymphomas. Ann. N.Y. Acad. Sci. 428: 158-172,
1984.
29.
Sonderegger, P., Lemkin, P.F., Lipkin, L., Nelson, P.:
Differential modulation of the expression of axonal proteins by
non-neuronal cells and the peripheral and central nervous system.
EMBO J. 4: 1395-1401, 1985.
(PDF)
30. Lemkin, P.F., Lipkin, L.E.: GELLAB: Multiple 2D electrophoretic
gel analysis. In Allen, R. and Arnaud (Eds.):
Electrophoresis '81. New York, W. De Gruyter, 1981,
pp. 401-411.
31. Lemkin, P.F. , Lipkin, L.E.: Database techniques for 2D
electrophoretic gel analysis. In Geisow, M. and Barrett,
A. (Eds.): Computing in Biological Science. North Holland,
Elsevier, 1983, pp. 181-226.
32. Lester, E.P., Lemkin, P.F.: A 'GELLAB' computer assisted 2D gel
analysis of states of differentiation in hematopoietic cells. In
Neuhoff, V. (Ed.): Electrophoresis '84. Chemie,
Springer-Verlag, 1984, pp. 309-311.
33.
Lemkin, P.F., Shapiro, B., Lipkin, L., Maizel, J., Sklansky, J.,
Schultz, M.: Preprocessing of electron micrographs of nucleic acid
molecules for automatic analysis by computer. II. Noise removal
and gap filling. Comput. Biomed. Res. 12: 615-630, 1979.
34.
Lipkin, L., Lemkin, P.F., Shapiro, B., Sklansky, J.: Preprocessing
of electron micrographs of nucleic acid molecules for automatic
analysis by computer. Comput. Biomed. Res. 12: 279-289, 1979.
35.
Shapiro, B., Lipkin L.: The circle transform, an articulable shape
descriptor. Comput. Biomed. Res. 10: 511-28, 1977.
36.
Shapiro, B.: Language processor generation with BNF inputs:
methods and implementation. Comp. Programs. Biomedicine 7:85-98,
1977.
37. Shapiro, B., Pisa, J., Sklansky, J.: Skeletons from sequential
boundary data. Proc. Intl. Conf. On Pattern Recognition and Image
Processing. IEEE Comp. Soc. Press, Los Angeles, CA., 265-270,
1979.
38. Shapiro, B., Pisa, J., Sklansky, J.: Skeleton generation from xy
boundary sequences. Comp. Vision Graphics Image Processing
15(2) 136-153, 1981.
39.
Shapiro, B.S., Lipkin, L.E., Maizel, J.V.: Computerized generation
of secondary structure maps for nucleic acids. Comp. Biomed.
Res. 12(6):545-568, 1979.
40.
Lemkin, P.F., Lipkin, L.: BMON2 - A distributed monitor system for
biological image processing. Computer Programs in Biomedicine 11:
21-42, 1980.
(PDF)
Reprinted from COMPUTER METHODS AND PROGRAMS IN BIOMEDICINE,
Vol 11, Lemkin PD and LipkinL, BMON2 - A distributed monitor system for
biological image processing, Pages 21-42, Copyright (1980), with permission
from Elsevier.
41. Lipkin, B.S., Rosenfeld, A. (Eds): Picture Processing and
Psychopictorics. Academic Press, New York, 1970, pps 526.
42. Lemkin, P.F.: GELLAB-II: A workstation based 2D electrophoresis
gel analysis system. In Endler, T. and Hanash, S. (Eds.):
Proceedings of 2D Electrophoresis. West Germany, VCH Press, 1989,
pp. 52-57. (This was the announcement of GELLAB-II)
43.
Lemkin, P.F., Lester, E.P.: Database and search techniques
for 2D gel protein data: A comparison of paradigms for exploratory
data analysis and prospects for biological modeling.
Electrophoresis 10(2): 122-140, 1989.
44.
Robinson, M.K., Myrick, J.E., Henderson, L.O., Coles, C.D.,
Powell, M.K., Orr, G.A., Lemkin, P.F.: Two-dimensional protein
electrophoresis and multiple hypothesis testing to detect potential
serum protein biomarkers in children with fetal alcohol syndrome.
Electrophoresis 16: 1176-1183, 1995.
45.
Stoeckli, E.T., Lemkin, P.F., Kuhn, T.B., Ruegg, M.A.,
Heller, M., Sonderegger, P.: Identification of proteins secreted
from axons of embryonic dorsal-root-ganglia neurons.
Eur. J. Biochem. 180: 249-258, 1989.
46.
Lemkin, P.F., Thornwall, G., Walton, K., Hennighausen, L: The
Microarray Explorer tool for data mining of cDNA microarrays -
application for the mammary gland, Nucleic Acids Res. 20(22):
4452-4459, 2000.
47.
Shapiro, B.A.: An algorithm for comparing multiple RNA secondary
structures. Comput. Appl. Biosci. 4(3): 387-393, 1988.
48.
Margalit, H., Shapiro, B.A., Oppenheim, A.B., Maizel, J.V. Jr.:
Detection of common motifs in RNA secondary structures. Nucleic
Acids Res. 17(12): 4829-4845, 1989.
49.
Le, S.Y., Owens, J., Nussinov, R., Chen, J.H., Shapiro, B.,
Maizel, J.V.: RNA secondary structures: comparison and determination
of frequently recurring substructures by consensus. Comput. Appl.
Biosci. 5(3): 205-210, 1989.
50.
Shapiro, B.A., Kasprzak, W.: STRUCTURELAB: a heterogeneous
bioinformatics system for RNA structure analysis. J Mol. Graph.
14(4): 194-205, 222-224, 1996.
back to top of section
Technical Reports:
These reports were archived in the U.S. Department of Commerce's
National Technical Information Service (NTIS) in Springfield VA. They
currently offer online reports from 1990 on their web site http://www.ntis.gov/, although older
reports can be ordered. Some additional reports appeared as University
of Maryland Computer Science Center technical reports.
TR-2. Lemkin, P.F.: DDTG - Functional specification for the RTPP
monitor. NCI/IP TR-2, 2-5-1976. NTIS Accession No. PB250726/AS,
Springfield, VA, 1976, 90 pp. (Also in DECUS No. 8-823). (PDF)
TR-7. Lemkin, P.F., Carman, G., Lipkin, L., Shapiro, B., Schultz, M.:
Real time picture processor: Description and specification. NCI/IP
TR-7, 2-31-1976. NTIS Accession No. PB252268/AS, Springfield, VA,
1976, 139 pp. (PDF)
TR-7a. Lemkin, P.F.: Real Time Picture Processor: Description and
specification. TR-7a, 6-23-1977. NTIS Accession No. PB269600/AS,
Springfield, VA, 1977, 185 pp. (PDF TR-7a)
TR-8. Lemkin, P.F., Shapiro, B., Gordon, R., Lipkin, L.: PROC10 - An
image processing system for the PDP10: Description and
specification. NCI/IP TR-8, 12-16-1976. NTIS Accession
No. PB261535/AS. Springfield, Va., 1976, 53 pp. (Also in DECUS
No. 10-270). (PDF)
TR-15. Shapiro, B., Lemkin, P.F.: PRDL - Procedural Description
Language. NCI/IP TR-15, 10-10-1977. NTIS Accession No. PB273112/AS
Springfield, Va., 1977, 23 pp. (PDF)
TR-16. Lemkin, P.F., Shapiro, B., Schultz, M., Lipkin, L., Carman, G.:
GPPASM - A PDP8e assembler for the General Picture Processor. NCI/IP
TR-16, 12-15-1976. NTIS Accession No. PB261537/AS, Springfield, VA,
1976, 45 pp. (PDF)
TR-21. Lemkin, P.F.: Buffer memory monitor system for interactive image
processing. NCI/IP TR-21, 3-31-1976. NTIS Accession No. PB261536/AS,
Springfield, VA, 1976, 26 pp.
(PDF)
TR21-b. Lemkin, P.F.: BMON2 - buffer memory monitor system for
interactive image processing. NCI/IP TR-21b, 3-17-1978. NTIS
Accession No. PB269642/AS, Springfield, VA, 1978, 112 pp. (PDF)
TR-22. Carman, G., Lemkin, P.F., Schultz, M., Lipkin, L., Shapiro, B.:
Microprogram control architecture for the General Picture Processor.
NCI/IP TR-22, 4-22-1977. NTIS Accession No. PB269762/AS, Springfield,
VA, 1977, 35 pp. (PDF)
TR-23. Lemkin, P.F.: BMOMNI - Fortran interface program for the RTPP
buffer memory, Quantimet and control desk. NCI/IP TR-23,
12-14-1976. NTIS Accession No. PB261538/AS, Springfield, VA, 1976, 10
pp. (PDF)
TR-472. Shapiro, B.: The use of orthogonal expansion for biological
shape description. College Park, MD, University of Maryland Computer
Science Center TR-472, Aug. 1976, pp 30.
TR-653. Lemkin, P.F.: Bone marrow smear image analysis. College
Park, MD, University of Maryland Computer Science Center TR-653,
April, 1978, 156 pp. (PDF)
TR-655. Lemkin, P.F.: The run length map: A representation of contours
and regions for efficient search and low level semantic
encoding. College Park, MD, University of Maryland Computer Science
Center TR-655, April, 1978, 60 pp. (PDF)
TR-BAS78. Shapiro, B.S.: "Shape description using boundary sequences",
U. Maryland Computer Science Dept, 1978. (Ph.D. dissertation).
back to top of section
Peter F. Lemkin, Lemkingroup.com
(Note: You may also access the PDF and journal articles on the lemkingroup.com
RTTP history mirror
.)
Original: 02/25/2007, Version #57 - original released to History of NIH
Revised: 9/22/2011, Version: #59 - fixed missing links and navigation change
Revised: 8/12/2011, Version: #60 - Added BMON2 code for RTPP and removed links
to CCRNP
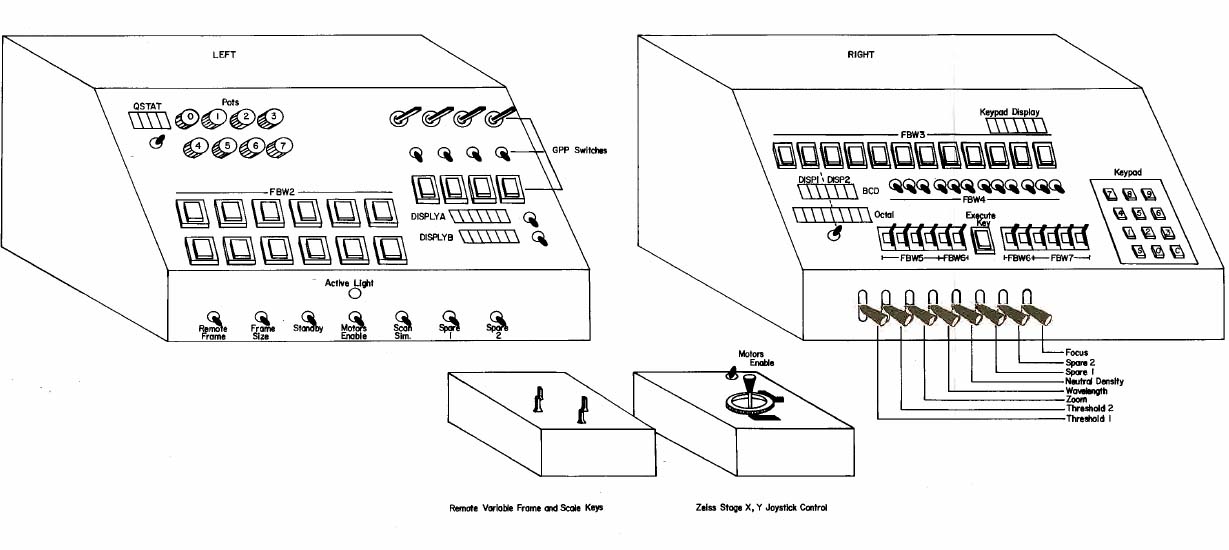 Figure 6. RTPP Control Console was interfaced to the PDP8e and used to
interact with the RTPP using the BMON2 buffer memory monitor operating
system
[40,
TR-21,
TR-21b].
See Figure 2 in [TR-21b] for the full
description. It had various knobs (connected to A/D converters read by
the PDP8e), lights for feedback, command buttons, toggle switches, and
momentary toggle switches. Only some of these controls were used in
the various programs, but having a variety of control options
providing flexibility in the user interface. However, this was
sometimes at the cost of added complexity and sometimes users had
difficulty in learning the system because of this. ("All those knobs,
buttons and switches!") However, this flexibility gave us the option
of experimenting with various interaction modes that could then be
optimized for particular analysis programs. This was before the
computer mouse and graphical user interfaces became commonly
available. (Click on this figure to bring up the high-resolution
version of the figure. You may have to make your browser window
larger.)
Figure 6. RTPP Control Console was interfaced to the PDP8e and used to
interact with the RTPP using the BMON2 buffer memory monitor operating
system
[40,
TR-21,
TR-21b].
See Figure 2 in [TR-21b] for the full
description. It had various knobs (connected to A/D converters read by
the PDP8e), lights for feedback, command buttons, toggle switches, and
momentary toggle switches. Only some of these controls were used in
the various programs, but having a variety of control options
providing flexibility in the user interface. However, this was
sometimes at the cost of added complexity and sometimes users had
difficulty in learning the system because of this. ("All those knobs,
buttons and switches!") However, this flexibility gave us the option
of experimenting with various interaction modes that could then be
optimized for particular analysis programs. This was before the
computer mouse and graphical user interfaces became commonly
available. (Click on this figure to bring up the high-resolution
version of the figure. You may have to make your browser window
larger.)
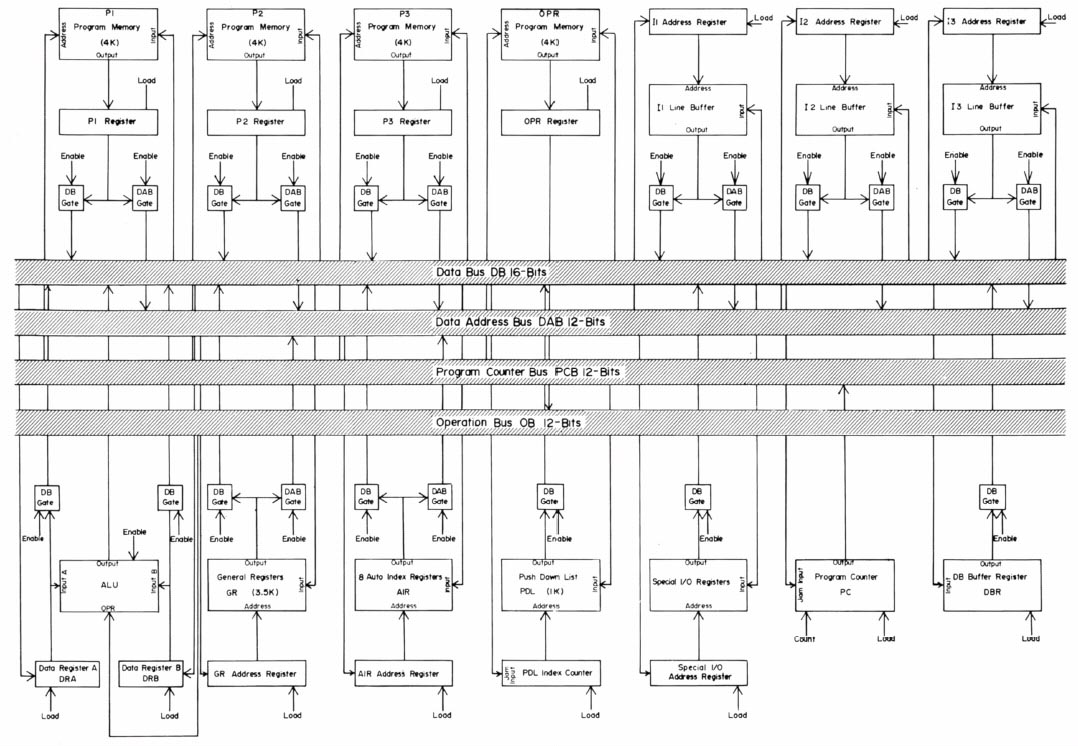 Figure 12. The RTPP general picture processor (GPP) bus structure
(reproduced with permission from J. Histochem. Cytochem.
[4],
1974). "The instruction addressing sequence is done serially. That is,
Pi is addressed, then P2, then P3. Let 'c(.)' denote 'contents of
current memory location'. If any address is immediate, no memory fetch
is done. Rather, the PM data, c(P), is enabled onto the data bus
DB. If direct addressing mode c(c(P)) is used, the PM data c(P) is
enabled onto the data address bus, DAB, and then loaded onto the
appropriate data field address register. The memory then enables its
data, c(c(P)), onto the data base, DB. If indirect mode is used then
the same sequence is repeated as for direct mode, but c(c(P)) is
enabled back onto the DAB instead of the DB. Then the data address
field register addressed is loaded and the c(c(c(P))) from that memory
is enabled onto the DB. A conflict may occur in the use of the
indirect mode from the 'MOVE' instruction. This is resolved by storing
the source data in the data bus register, DBR, temporarily. Various
devices and memories are connected to the bus structure and interact
when the control section activates them. The average GPP instruction
time is designed to be on the order of 250 nanoseconds." (Click on
this figure to bring up the high-resolution version of the figure. You
may have to make your browser window larger.)
Figure 12. The RTPP general picture processor (GPP) bus structure
(reproduced with permission from J. Histochem. Cytochem.
[4],
1974). "The instruction addressing sequence is done serially. That is,
Pi is addressed, then P2, then P3. Let 'c(.)' denote 'contents of
current memory location'. If any address is immediate, no memory fetch
is done. Rather, the PM data, c(P), is enabled onto the data bus
DB. If direct addressing mode c(c(P)) is used, the PM data c(P) is
enabled onto the data address bus, DAB, and then loaded onto the
appropriate data field address register. The memory then enables its
data, c(c(P)), onto the data base, DB. If indirect mode is used then
the same sequence is repeated as for direct mode, but c(c(P)) is
enabled back onto the DAB instead of the DB. Then the data address
field register addressed is loaded and the c(c(c(P))) from that memory
is enabled onto the DB. A conflict may occur in the use of the
indirect mode from the 'MOVE' instruction. This is resolved by storing
the source data in the data bus register, DBR, temporarily. Various
devices and memories are connected to the bus structure and interact
when the control section activates them. The average GPP instruction
time is designed to be on the order of 250 nanoseconds." (Click on
this figure to bring up the high-resolution version of the figure. You
may have to make your browser window larger.)